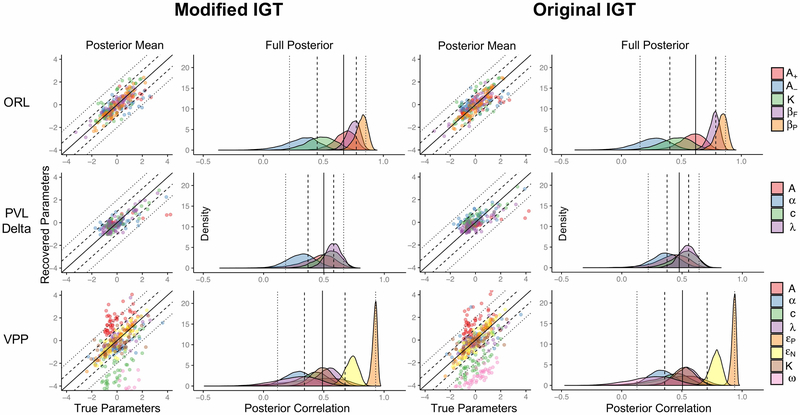
Figure 4: Parameter recovery results across models and versions of the IGT.
Note. Parameter recovery results for the modified and original IGT tasks. Each task structure was simulated for each model using the same set of 48 individual-level parameter sets across modified and original task structures. Posterior mean results show comparisons of the true parameters with the means of the posterior distributions of the recovered parameters after being standardized. We standardized parameters by z-scoring the true and recovered posterior means by the mean and standard deviation of each of the 48 true parameter sets. This method allowed us to visualize the bias in recovered posterior means, where any values falling above or below the solid diagonal line indicate higher or lower recovered means in reference to the true parameters, respectively. Dashed and dotted lines reflect 1 and 2 standard deviations in the standardized space, respectively. Note that some parameter values fell outside of the graphs (particularly for the VPP), but zooming out further obfuscates the results. Full posterior recovery results were generated by computing a Spearman’s rank-order correlation between each set of individual-level true parameters and the respective set of individual-level recovered parameters for each sample in the recovered posterior distribution. Full posterior recovery results therefore represent the uncertainty in recovering the relative positions of the true parameters across all individual-level parameters (i.e. across all “subjects”). Distributions with mass closer to 1 indicate that the order between true parameters is recovered well for a given parameter and model. Dotted lines represent 2.5% and 97.5% quantiles, dashed lines represent 25% and 75% quantiles, and the solid line represents the median. Quantiles were calculated across all parameters.

