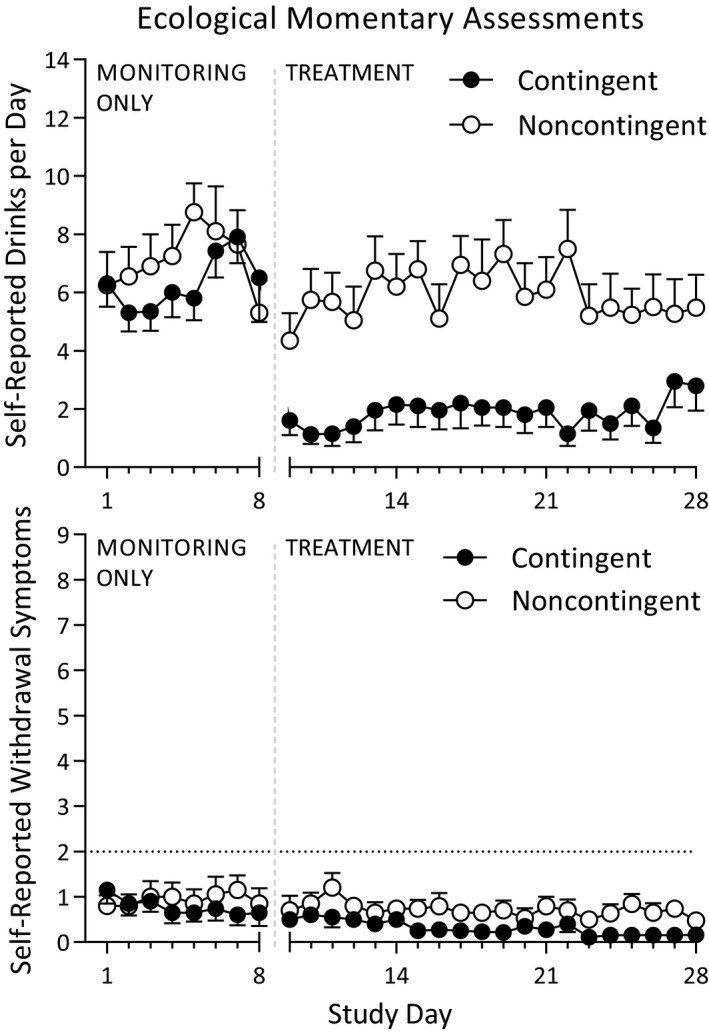
Figure 3.

Ecological momentary assessments of drinks per day and withdrawal symptoms collected throughout the monitoring only and treatment phases. Drinks per day were significantly lower in the contingent group during the treatment phase only (top), and withdrawal symptoms were similarly low throughout the study in both groups (bottom).
