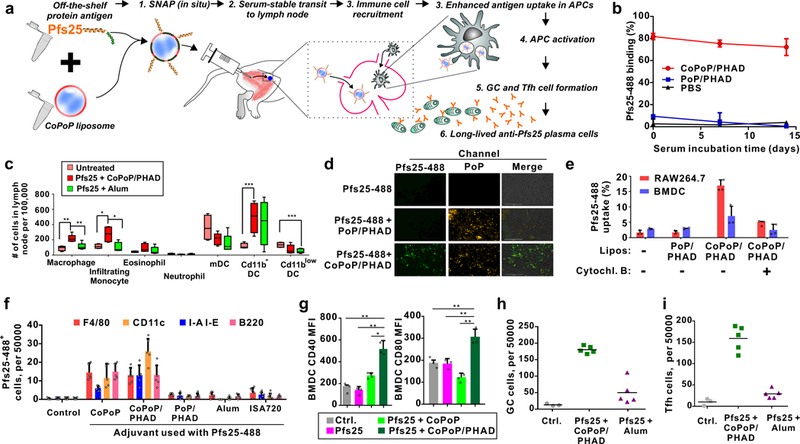
Figure 3: Mechanistic insights into SNAP immunization.

a, Putative steps in SNAP immunization. b, Particleization stability in 20% human serum at 37 °C. c, Immune cell populations in draining lymph nodes 48 hours after intramuscular Pfs25 immunization. Data show box-and-whiskers plot (n = 5 mice per group). The line represents the median, the whiskers show data range and the box shows the interquartile range. d, Fluorescence microscopy of RAW264.7 macrophages after incubation with Pfs25 and liposomes. Bar: 100 µm. Representative images from 3 independent experiments. e, Pfs25 uptake following incubation with murine RAW264.7 or BMDC cells. Cytochalasin B was used as a phagocytosis inhibitor. f, Pfs25 uptake in immune cells in draining lymph nodes of mice, 48 hours after intramuscular administration. Lymph nodes cells were assessed for Pfs25–488 uptake with flow cytometry and co-staining with indicated surface markers. g, Activation of BMDCs as assessed by CD40 or CD80 mean fluorescence intensity (MFI) following incubation with 1 µg/mL of Pfs25 for 24 hr. (h) Germinal center (GC) cells (GL7+CD95+; within the B220+ cell population) and (i) Tfh cells (CXCR5+PD-1+; within the CD4+ cell population) in draining lymph nodes, 7 days after intramuscular immunization with 100 ng Pfs25. b, line shows mean +/−std. dev. for n=3 experiments. f, bars shows mean +/−std. dev. with n=5 mice per group. e and g, value shows mean +/−std. dev. for n=3 biologically independent experiments. h and i, lines show mean for n=5 mice per group. Asterisks show significance for unpaired, two-tailed Student’s T –test: * p<0.05; **p<0.01; ***p<0.005.
