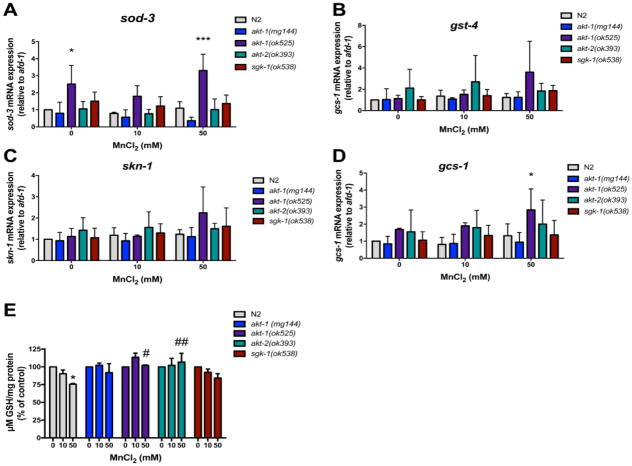
Fig. 4.
N2 (WT) or null mutants akt-1(ok525), akt-2(ok593), sgk-1(ok538) or gain-of-function mutant akt-1(mg144) were exposed to Mn for 1 h (10 or 50 mM). Controls were incubated with 85 mM NaCl. The worms were homogenized after treatment. Expression of sod-3 (A), gst-4 (B), skn-1 (C) and gcs-1 (D) relative to the constitutive gene afd-1 (β-actin) was normalized to the N2 control group. Results are expressed as mean ± S.E.M. of 3 to 4 experiments. (E) GSH levels were determined using a standard curve (μM GSH/mg protein). Results are expressed as percentage GSH content relative to same strain control and mean ± S.E.M. of 3 experiments. * p <0.05, ** p <0.01, *** p <0.001 compared to the N2 control group. # p <0.05, ## p <0.01 compared to group 50 mM N2. Two-way ANOVA followed by post hoc Tukey’s test.

