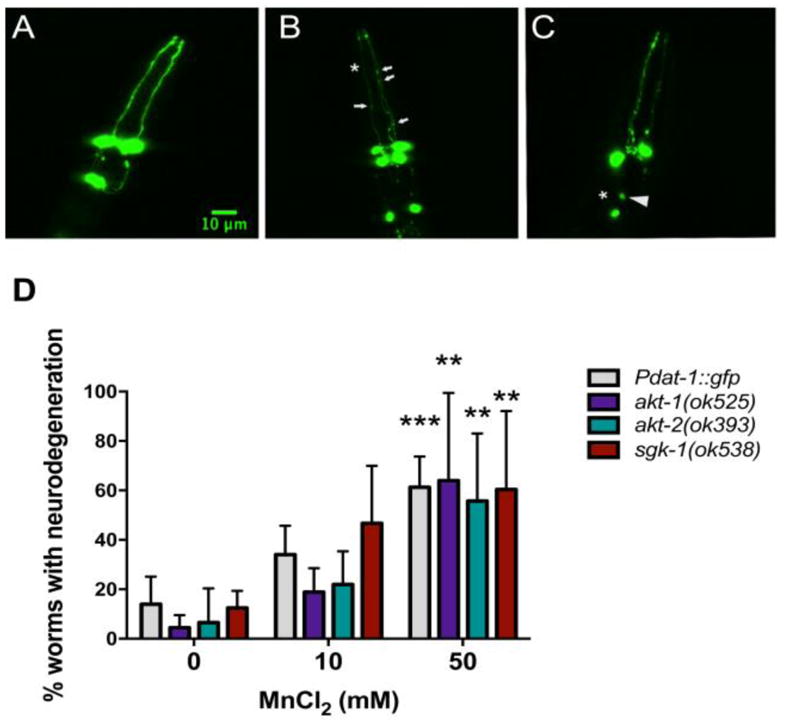
Fig. 5.

Morphology of CEPs and ADEs neurons DAergic neurons. Worms were evaluated 2 h after an acute treatment with MnCl2 (10 or 50 mM) by fluorescence microscopy (X 40 magnification). Controls were incubated with 85 mM NaCl. Worms with healthy neurons were scored as normal (A). Worms with any of the following changes in their dopaminergic neurons were quantified as containing degeneration: (B) puncta (discontinuous marking the dendrite, arrows), (C) loss or cell body shrinkage (arrowhead), loss of dendrites (asterisks), exemplified in the confocal images. (D) Data represent the percentage of worms with degeneration. Results are expressed as mean ± S.E.M. of 6 experiments. * P <0.05, *** p <0.001 compared to the control group. Two-way ANOVA followed by post hoc Tukey’s test. Representative images were obtained with a PerkinElmer spinning disk confocal, 40X objective. Scale bar represents 10 μm.
