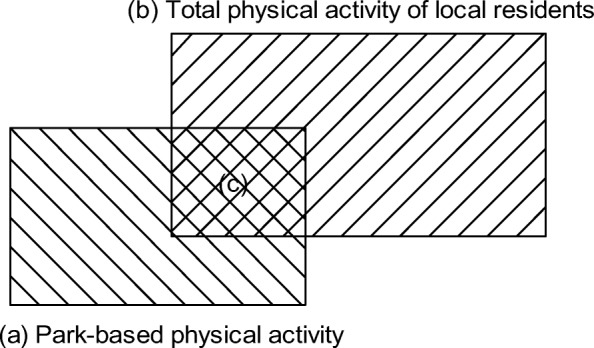
Fig. 1.

Rational for quantifying park’s contribution to the local population’s MVPA: rectangle (A) illustrates park-based MVPA by all park users; rectangle (B) stands for total MVPA of the local population, and the intersection (C) represents park-based MVPA by the local population.
