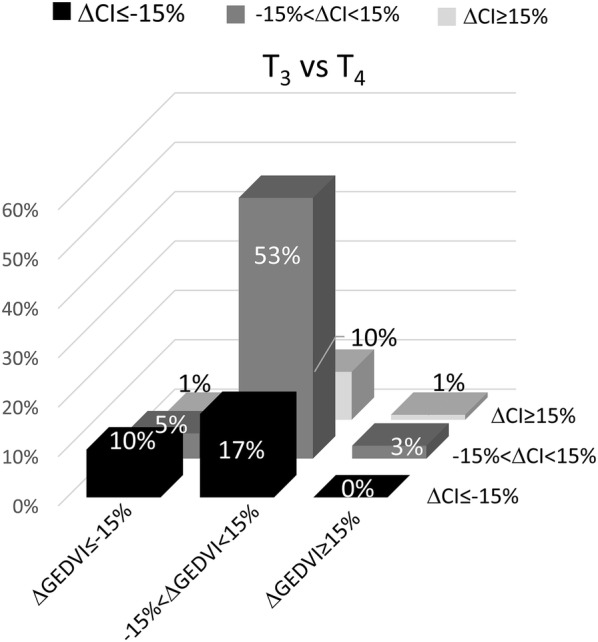
Fig. 4.

Hemodynamic pattern as a function of ΔCI and GEDVI between T3 and T4. Bars are percentage of patients falling in each category. CI, cardiac index; GEDVI, global end-diastolic volume index; ΔCI, change in CI; ΔGEDVI, change in GEDVI; T3, end of prone position session; T4, after prone position session
