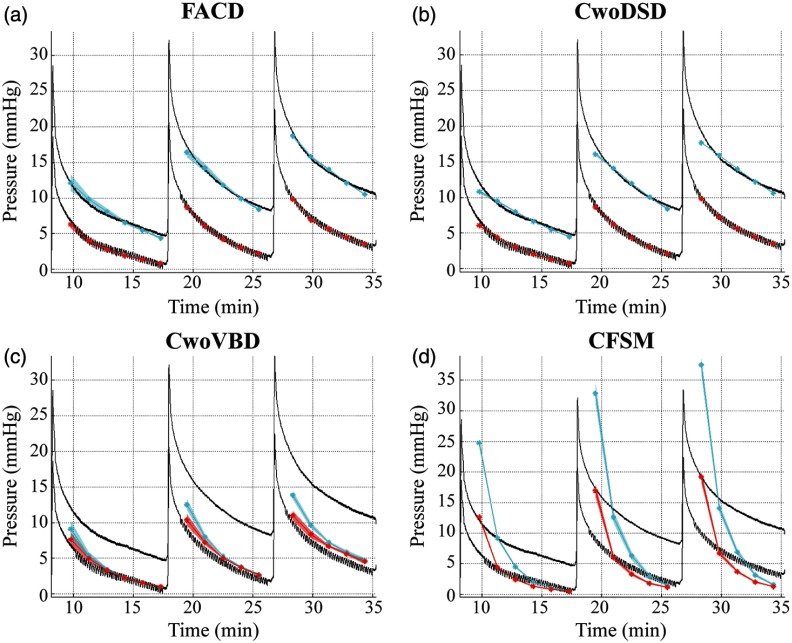
Fig. 4.
Experimental and model-estimated pressure for each boundary condition. The solid black lines represent experimental pressure data measured with the transducers. The solid cyan and red lines are the average pressure results in the near hemisphere transducer and far hemisphere transducer, respectively. The translucent red and cyan areas are +/− two standard deviations of the average pressure result calculated at each time point. The pressure fits are the model estimated pressure obtained by the solution of the inverse problem for (a) the full anatomical condition (FACD), (b) the dural septa not included (CwoDSD), (c) the ventricle boundary condition not included (CwoVBD), and (d) the brain tissue treated as fully saturated (CFSM).

