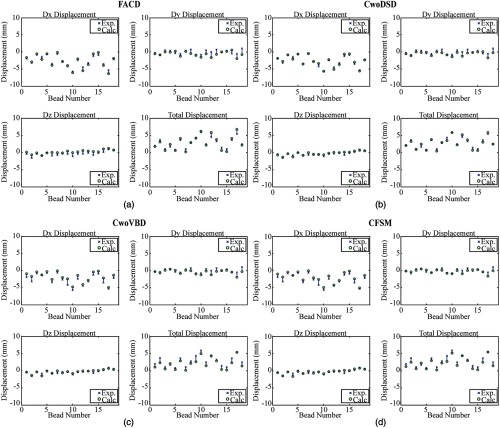
Fig. 6.
Displacement calculations from the best fits runs from the 10-mm piston translation quantify the model calculated (Calc.) bead displacements at the conclusion of the simulated piston translation and compare them to the experimentally (Exp.) measured displacements. In each panel, the top left, top right, and bottom left subfigures represent the displacement calculations in the , , and axes respectively, while the subfigure on the bottom right represents the total displacement.

