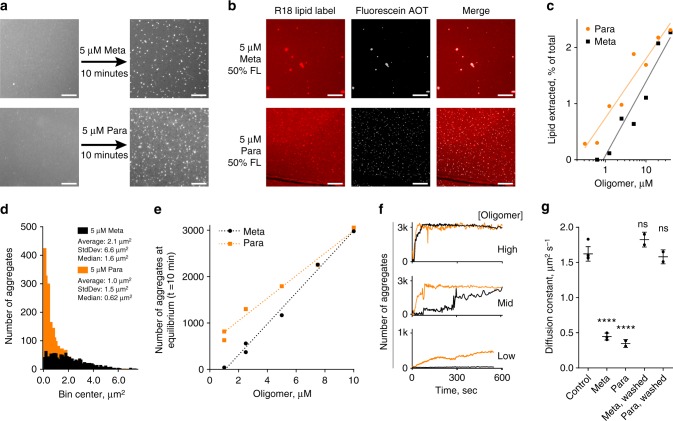
Fig. 4.
Visualization of aggregate count, size, and kinetic formation, as well as evidence of membrane loss and binding. a Fluorescent micrographs of before and after 10 min of oligomer exposure, R18 visualizes the lipids. b Use of fluorescein Meta and Para demonstrated oligomer participation via colocalization in the aggregate (10 min, 5 μM total, 50 %FL, washed with PBS). All scale bars are 25 μm. c Capture of lipid particles evolved from surface quantified by plate reader fluorescence as a percentage of total within the microscopy well. Semi-log lines are an aid to the eye (n = 1). d Histogram of aggregate sizes on microscopy images determined by ImageJ particle analysis. e Total number of aggregates in microscopy image after 10 min vs. oligomer concentration showed a threshold of efficiency. A linear regression is shown to aid the eye. At high (active) oligomer concentration the oligomers were indistinguishable; at low concentration the Para developed more aggregates, as it is more potent. Individual SLBs were observed (n = 1) for all concentrations except 1 μM Meta and 2.5 μM Para, where n = 2. f Kinetics of aggregate formation showing the oligomers are indistinguishable at high concentration, but distinguishable at intermediate and low concentrations. 10 μM, 7.5 μM, and 1 μM are the high, mid, and low concentrations, respectively. Note for 1 μM the y axis is 1k, whereas for 10 μM and 7.5 μM the scale is 3k aggregates. g FRAP experiment revealing reversible decrease in membrane diffusivity when equilibrated with 10 μM oligomer from a molecular, non-aggregate state (****p < 0.0001; ns p > 0.05, unpaired t-test, two-tailed). FRAP replicates represent membrane heterogeneity, n = 4,3,2,2 for the Control, Meta, Para, Meta Washed, and Para Washed, respectively (see Supplementary Figure 18 for mobile fraction).

