Fig. 1.
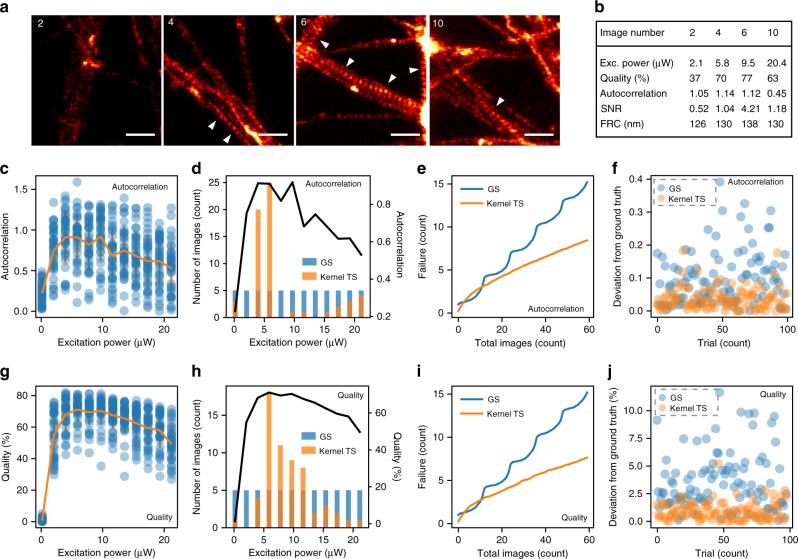
Replay experiment of single-objective optimization. a Selected images of actin, labeled with phalloidin-STAR635 in fixed cultured hippocampal neurons, from the first ten images of the dataset at four increasing laser power values. Scale bars 1 μm. White arrowheads: actin periodical lattice. b Comparison between the quality scores, SNR, autocorrelation of the periodical actin lattice, and FRC measurements obtained for the images shown in a and acquired at the indicated excitation power. c, g Autocorrelation (c) and image quality (g) values measured for all images of the dataset (blue dots) and average of the 39 autocorrelation (c) or quality (g) values per excitation power (orange line). d, h Distribution of the selected excitation power for 60 images obtained in one replay trial for both GS and Kernel TS when evaluating the autocorrelation (d) or the image quality (h). The black line indicates the averaged functions (orange line in c and g) for autocorrelation and for image quality. e, i Average cumulative regret of imaging failures (not detecting the actin periodical lattice) when optimizing the autocorrelation (e) or image quality (i). Note that the wave pattern is due to the decreasing probability of obtaining good images as parameters move further away from the relevant region. f, j Error between the estimated and ground truth autocorrelation (f) or image quality (j) values at the excitation power that was most often selected by Kernel TS for each optimization trial. g, h Quality scores from 0 to 1 are expressed in percentage

