Fig. 2.
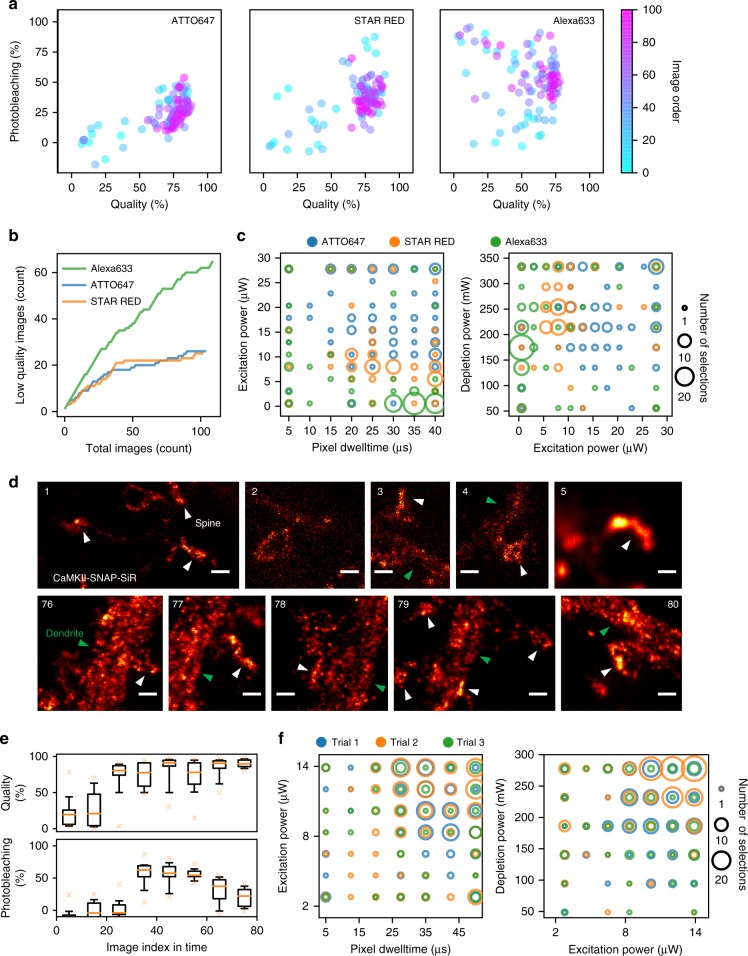
Multi-objective optimization of STED imaging on fixed and live neurons. a Evolution of the objectives during an optimization sequence, from first (cyan) to 100th image (pink), for the protein α-tubulin marked with ATTO647, STAR RED, and Alexa633. b Cumulative regret (related to the quantity of low-quality images, i.e. below 70%) obtained during the Kernel TS optimization sequences shown in a. c Parameter configurations selected by Kernel TS for fluorophores shown in a. d Example images of αCaMKII tagged with SNAP-SiR of the first five (1–5) and last five (76–80) images taken during one live-cell optimization trial. White and green arrowheads highlight the position of dendritic spines and shafts respectively. Scale bars 500 nm. e Distribution of image quality and photobleaching for one optimization sequence of αCaMKII-SNAP-SiR (Trial 2 in panel f). One bin corresponding to the average of ten images. Orange line indicates the median, box covers the first to the third quartiles, and whiskers extend from 10th to 90th percentiles. f Parameter configurations selected by Kernel TS during different live-cell imaging trials. In c and f the size of the circles scales with the number of images that were acquired with a given configuration. Shown are two planes of the three-dimensional parameter space. Quality scores from 0 to 1 are expressed in percentage

