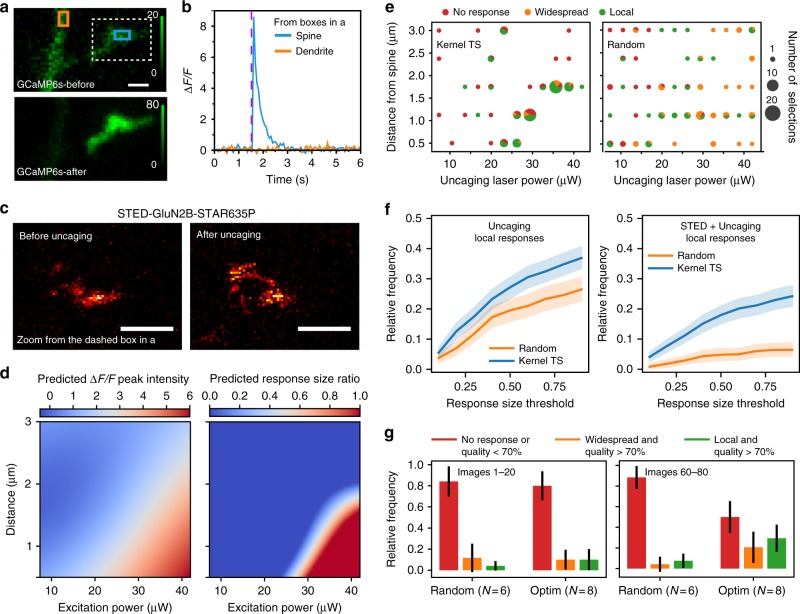
Fig. 4.
Multimodal optimization in living cells. a GCaMP6s fluorescence before and after glutamate uncaging. b Change in Ca2+ concentration inside the ROIs in spine (cyan rectangle in a) and dendrite (orange rectangle in a). Ca2+ response was limited to the spine. c GFP-GluN2B tagged with FluoTag-X4 anti-GFP STAR635P before and after uncaging (zoomed inset from the dotted box in a). Scale bars 500 nm. d Objective functions, i.e. ΔF/F peak intensity (left) and response size ratio (right), predicted by kernel regression after 80 observations. The colorbar indicates the predicted value for this objective, in the objective units. e Types of Ca2+ responses after glutamate uncaging for the selected parameters during one optimization (left) and random sampling (right) trials. Pie charts show the repartition between response types, i.e. local (green), widespread (orange) and no response above threshold (red). The size of each pie chart is proportional to the number of trials of the parameter configuration. f Relative frequency of local response ratios over all images obtained in several trials of 80-image sequences, for different response size ratio threshold values. 95% confidence intervals are obtained by 1000 bootstrap repetitions. g Comparison of the success rate of multimodal experiments using RS and Kernel TS for the images 1–20 and 60–80. Vertical bars indicate one standard deviation computed over the N repetitions. With Kernel TS, a significant increase in the frequency of local responses and decrease in the no-response rate are observed between the first and the last images (Kruskal−Wallis, p = 0.01 and p = 0.004 respectively), with RS no significant difference in the frequency of local response and no-response rate was observed between the first and the last images (Kruskal−Wallis, p = 0.45 and p = 0.57 respectively). e, g The threshold for the response size ratio was set to 0.6

