Figure 4.
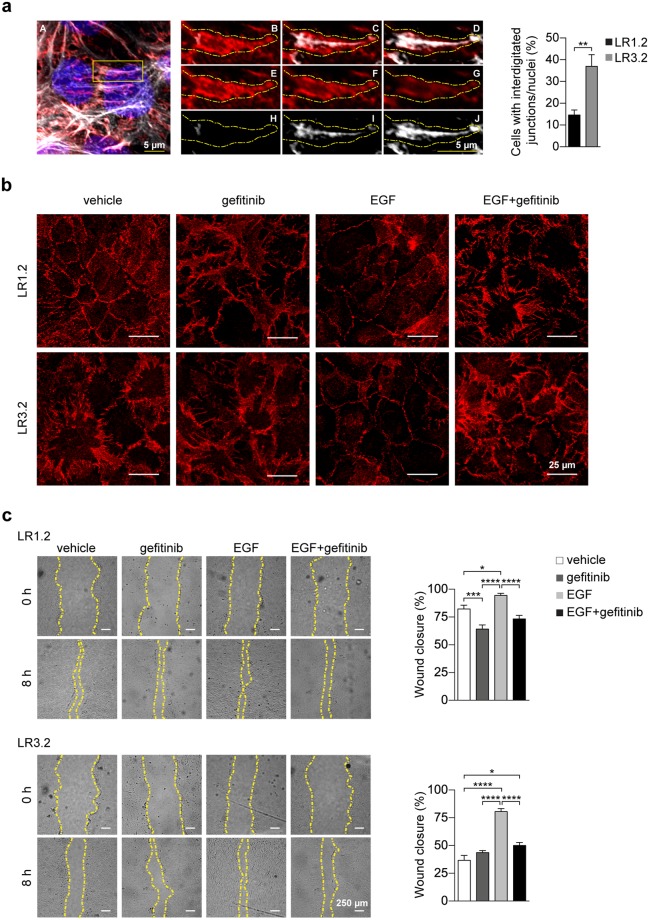
E-cadherin distribution at the cell-cell junctions and its modulation by EGF. (a) Representative confocal microscopy projection image of LR3.2 cell line stained with E-cadherin antibody (red), phalloidin-647 (gray) and DAPI (blue). Digital enlargements of the indicated yellow box (A) of three different z planes (B–D; E–G; H–J) of xy projections show a finger detail, in merged (B–D), red (E-cadherin) (E-G) and white (phalloidin) (H–J) channels. Scale bars (5 μm) are indicated. Interdigitated E-cadherin junctions were counted in 6 different confocal microcopy images for each cell line in two independent experiments: 1000 cells were counted by using ImageJ. Bar plots indicate the percentage of cells with interdigitated E-cadherin positive junctions respect to the total number of nuclei (p = 0.002, n = 6). Statistical analysis was performed by Wilcoxon rank sum test for the comparison of LR3.2 with LR1.2 cell lines. (b) Representative confocal microscopy images of LR1.2 and LR3.2 cell lines stained with E-cadherin antibody (red). Cells were treated as indicated with vehicle (DMSO), gefitinib (300 nM), EGF (50 ng/ml) and EGF + gefitinib for 48 hours in serum free media. Scale bars = 25 µm. (c) Representative images of wound healing experiments performed in LR1.2 and LR3.2 cell lines treated with vehicle (DMSO), gefitinib, EGF and EGF + gefitinib. Wounded areas are located within the yellow dashed lines. Scale bars = 250 µm. The wound closure was quantified in 14–16 images for the indicated cell lines at 8 hours post-wound. Bar plots represent the percentage of wound area closure in three independent experiments (LR1.2: gefitinib - DMSO, p = 0.0007; EGF - DMSO, p = 0.04; gefitinib - EGF and EGF - EGF + gefitinib, p < 0.0001. LR3.2: EGF - DMSO, p < 0.0001; EGF + gefitinib – DMSO, p = 0.01; gefitinib - EGF and EGF - EGF + gefitinib, p < 0.0001. n = 14–16). Statistical analysis was performed by ANOVA followed by the Tukey’s post-hoc test for every possible pair comparison. Significant p-values are represented by asterisks: *p < 0.05; **p < 0.01; ***p < 0.001; ****p < 0.0001. Non-significant p-values are not shown.

