Figure 5.
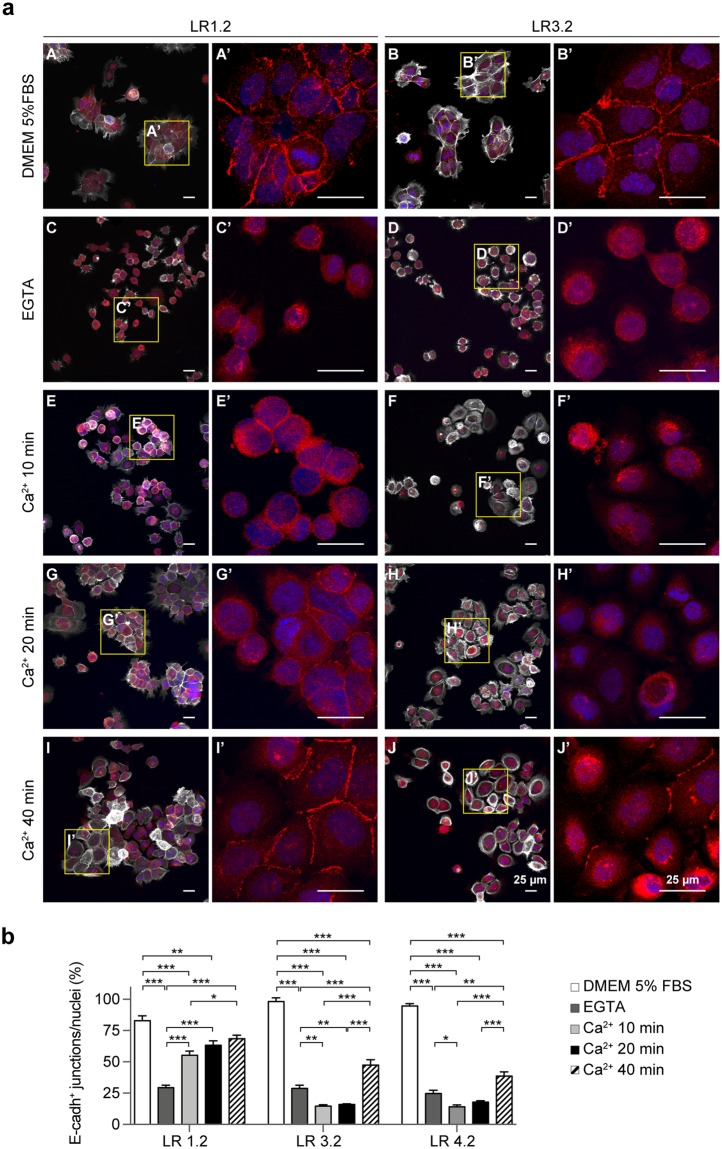
CASP4-silencing influences the de novo assembly of cell-cell junctions. (a) Representative confocal microscopy images of LR1.2 and LR3.2 cells stained with phalloidin-647 (grey) and E-cadherin (red). Cell lines cultured for 16 hours in complete 5% FBS-containing DMEM medium (A,B); cells starved in FBS free-medium and treated with 2 mM EGTA for 1 h (C,D); EGTA treated cells incubated with calcium containing medium for the indicated time points: 10 (E,F), 20 (G,H) and 40 (I,J) minutes. E-cadherin staining (red) of 4x digital enlargements are shown (A’–J’), corresponding to the yellow boxes indicated in A–J. (b) Bar plots indicate the percentage of E-cadherin positive mature junctions (length mean 12–45 µm) with respect to total number of nuclei counted by ImageJ in 4–11 fields with a comparable number of cells in two independent experiments (LR1.2: EGTA - DMEM, Ca2+ 10 min - DMEM, Ca2+ 10 min - EGTA, Ca2+ 20 min - EGTA, and Ca2+ 40 min - EGTA, p < 0.001; Ca2+ 20 min - DMEM, p = 0.009; Ca2+ 40 min - Ca2+ 10 min, p = 0.02. LR3.2: EGTA - DMEM, Ca2+ 10 min - DMEM, Ca2+ 20 min - DMEM, Ca2+ 40 min - DMEM, Ca2+ 40 min - EGTA, Ca2+ 40 min - Ca2+ 10 min, and Ca2+ 40 min - Ca2+ 20 min, p < 0.001; Ca2+ 10 min - EGTA, p = 0.003; Ca2+ 20 min - EGTA, p = 0.009. LR4.2: EGTA - DMEM, Ca2+ 10 min - DMEM, Ca2+ 20 min - DMEM, Ca2+ 40 min - DMEM, Ca2+ 40 min - Ca2+ 10 min, and Ca2+ 40 min - Ca2+ 20 min, p < 0.001; Ca2+ 10 min - EGTA, p = 0.02; Ca2+ 40 min - EGTA, p = 0.002; n = 4–11). Statistical analysis was performed by ANOVA followed by the Tukey’s post-hoc test for every possible pair comparison. Significant p-values are represented by asterisks: *p < 0.05; **p < 0.01; ***p < 0.001. Non-significant p-values are not shown.

