Figure 7.
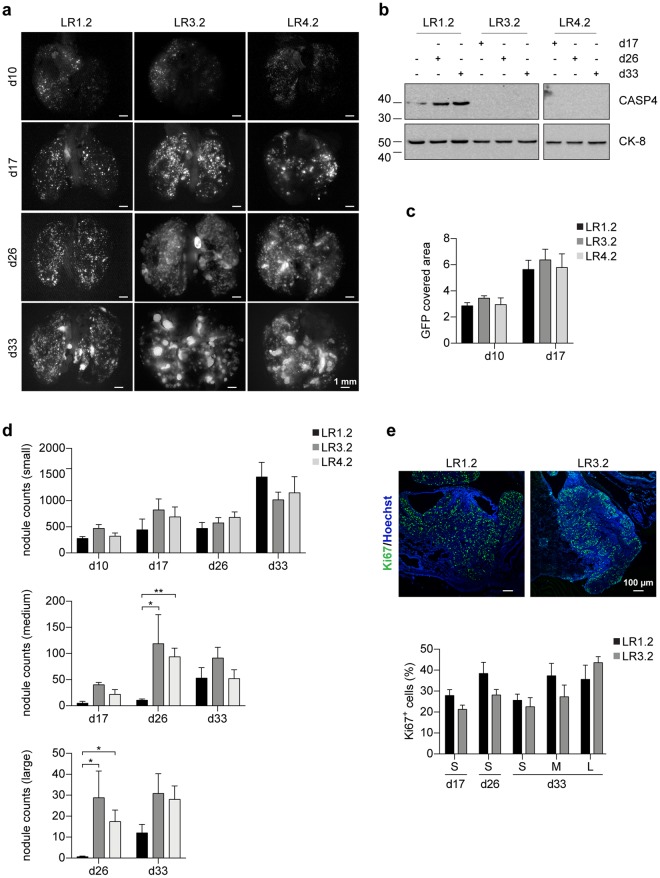
CASP4-silencing influences lung nodules size in nude mice. (a) Representative stereomicroscope images of lungs explanted from mice i.v. injected with LR1.2, LR3.2 and LR4.2 cell lines at the indicated time points (day) post-injection (d10, d17, d26, d33). Scale bars = 1 mm. (b) Western blot analysis of CASP4 expression on lysates obtained from homogenized lungs explanted from mice i.v. injected with LR1.2, LR3.2 and LR4.2 cell lines at the indicated time points post-injection (d17, d26 and d33). Cytokeratin peptide 8 (CK-8) was used to normalize sample loading. (c) Bar plots represent the mean of area covered by GFP at the indicated time points, assessed in three lungs (n = 6, ventral and dorsal lung sides of three mice). (d) Bar plots represent the number of small (area < 0.04 mm2), medium (0.04 ≤ area ≤ 0.25 mm2) and large (area > 0.25 mm2) nodules, at the indicated time points, counted by ImageJ in 3–5 lungs/group (day 26 medium nodules: LR1.2 - LR3.2, p = 0.02; LR1.2 - LR4.2, p = 0.008; day 26 large nodules: LR1.2 - LR3.2, p = 0.02; LR1.2 - LR4.2, p = 0.01; n = 3–5). (e) Confocal microscopy analysis of Ki67 (green) expression in lung FFPE slide from mice i.v. injected with LR1.2, and LR3.2 cell lines, 33 days upon injection. Images show representative xy-plane maximum projection of the specimens; scale bars = 100 µm (Top). Bar plots represent the percentage of Ki67 positive cells in lung nodules (small, n = 10–30; medium, n = 6–7; and large, n = 3–7) of mice i.v. injected with LR1.2 and LR3.2 cell lines. Statistical analysis relative to the comparison of LR3.2 and LR4.2 CASP4-silenced cell lines with the control LR1.2 cell line was performed by Wilcoxon rank sum test. Significant p-values are represented by asterisks: *p < 0.05, **p < 0.01. Non-significant p-values are not shown.

