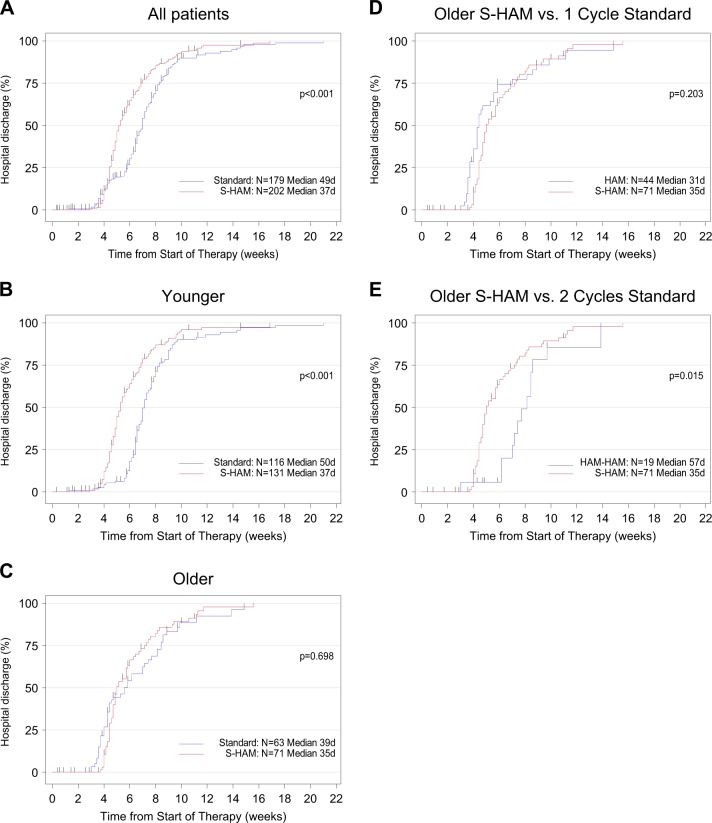
Fig. 5.
Duration of hospitalization. Duration of hospitalization in all patients (a), in patients younger than <60 years (b), in patients older than ≥60 years (c). Duration of hospitalization was calculated from the start of therapy until the day of discharge and was presented as inverse Kaplan–Meier curves. In (c) please note the “bump” in the standard group (blue line), which is due to the fact that one subgroup of patients received only one cycle of HAM (positive selection because of adequate blast clearance in the day 16 bone marrow aspirate) and the other subgroup received two cycles of HAM (negative selection because of residual blasts in the day 16 bone marrow aspirate). Comparison of the duration of hospitalization of all S-HAM patients older than ≥60 years versus those standard arm patients who received only one cycle of HAM (positive selection because of adequate blast clearance in the day 16 bone marrow aspirate) (d), of all S-HAM patients older than ≥60 years versus those standard arm patients who received two cycles of HAM (negative selection because of residual blasts in the day 16 bone marrow aspirate) (e)

