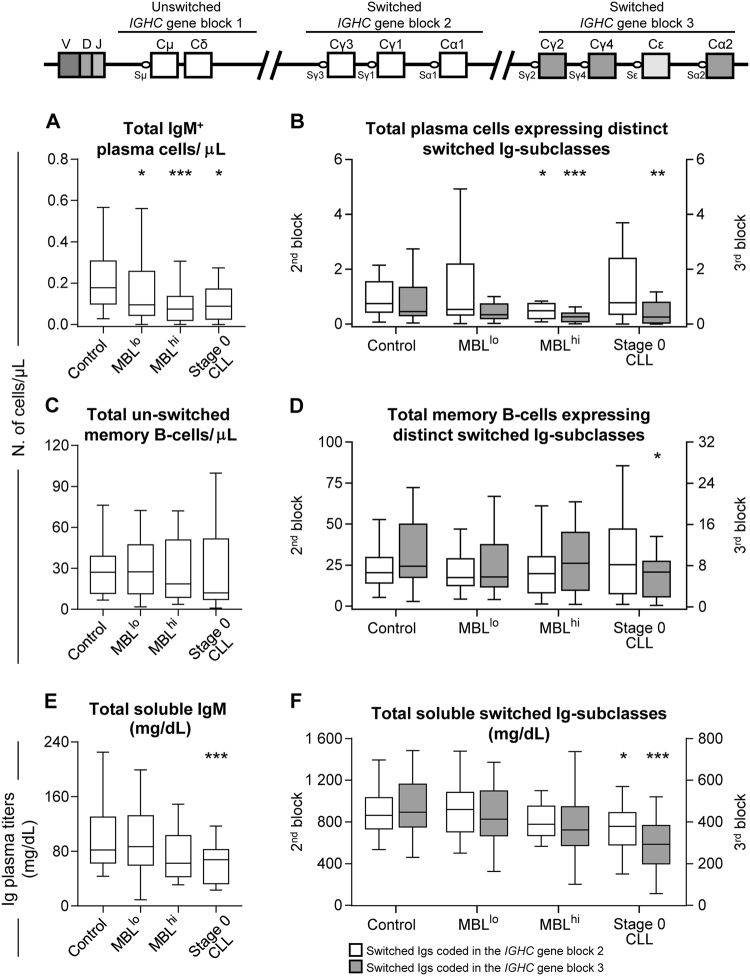
Fig. 2.
Distribution of PB antigen-experienced B-cell subsets expressing distinct Ig-subclasses and soluble Ig-subclass plasma titers grouped according to the position they occupy in the IGHC gene blocks. a, b The absolute number of IgM+ and switched plasma cells, respectively. c, d The absolute number of IgMD+ un-switched memory B-cells and switched memory B-cells are displayed, respectively. e, f Soluble IgM titers in plasma and the sum of the soluble levels of the different switched Ig-subclasses according to the distinct position that they occupy in the IGHC gene, respectively. b, c, and f White boxes represent the sum of those Ig-subclasses encoded in the second IGHC gene block, while gray boxes represent the sum of those Ig-subclasses encoded in the third IGHC gene block. The relative position and order of the different gene segments of the IGHC gene that encode for the different Ig-subclasses are depicted on the top of the figure. Notched boxes represent 25th and 75th percentile values; the lines in the middle correspond to median values and vertical lines represent the highest and lowest values that are neither outliers nor extreme values; *P ≤ 0.05 vs. controls; **P ≤ 0.01 vs. controls; ***P ≤ 0.001 vs. controls. MBLlo low-count monoclonal B-cell lymphocytosis, MBLhi high-count monoclonal B-cell lymphocytosis, CLL chronic lymphocytic leukemia

