Figure 3.
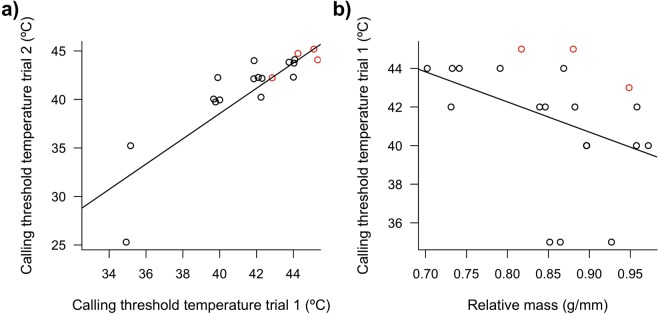
(a) Within individual correlation in the air temperature threshold (i.e. lowest temperature) triggering calling in their first and second trials. Points are slightly jittered for clarity. The points in red are for individuals that did not call during one (n = 3 individuals) or both (n = 1 individual) trials; we assumed these non-calling individuals had not reached their calling threshold, and used 1 °C above the maximal air temperature tested as their hypothetical calling threshold. Thresholds were highly correlated between trials within individuals, with or without these 4 extrapolated individuals (ρ = 0.87, P < 0.0001, n = 19 and ρ = 0.84, P < 0.0001, n = 15, respectively). (b) Air temperature threshold for calling in relation to individual relative body mass (i.e. mass in g divided by tarsus length in mm). As in (a) points in red are for individuals that did not call (in trial 1). Calling threshold was related to relative mass with or without these individuals (LM: t = −2.66, P = 0.017, n = 20; and t = −2.68, P = 0.019, n = 17; respectively) and time of day had a marginal effect (with all individuals only: t = 1.90, P = 0.076).

