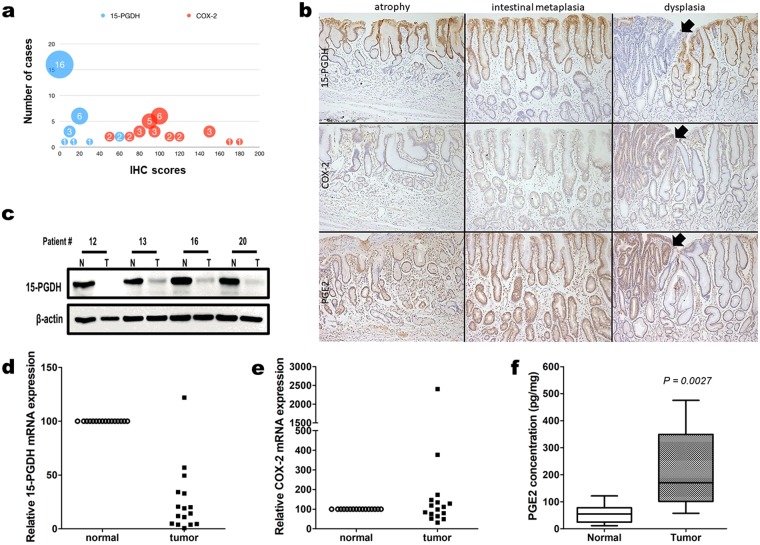
Figure 1.
(a) IHC scores of 15-PDGH (blue) and COX-2 (orange) expression in tumors from 30 cases of retrospectively collected ESD specimens. The paired t-test revealed a significant difference. (b) representative photomicrographs of 15-PGDH, COX-2, and PGE2 IHC in atrophy, intestinal metaplasia, and dysplasia (original magnification, x100). 15-PGDH (top row) lost its expression at dysplasia (arrows), but was visible until intestinal metaplasia. COX-2 (middle row) was weakly positive in intestinal metaplasia and strongly positive in dysplasia. PGE2 (bottom row) exhibited its highest expression in the dysplastic focus. (c) representative 15-PGDH WB from prospectively collected patient samples. Expression was markedly decreased or absent in tumor (T) samples relative to normal samples (N). (d,e) relative expression of 15-PGDH (HPGD, d) and COX-2 (PTGS2, e) mRNA in tumor samples relative to normal samples from patients. 15-PGDH (HPGD, d) exhibited significantly lower levels in the tumor samples. Some of the samples showed high COX-2 (PTGS2, e) levels, but it was not statistically significant. (f), the PGE2 concentration level was higher in the tumor samples. Error bars denote 5 to 95 percentile.

