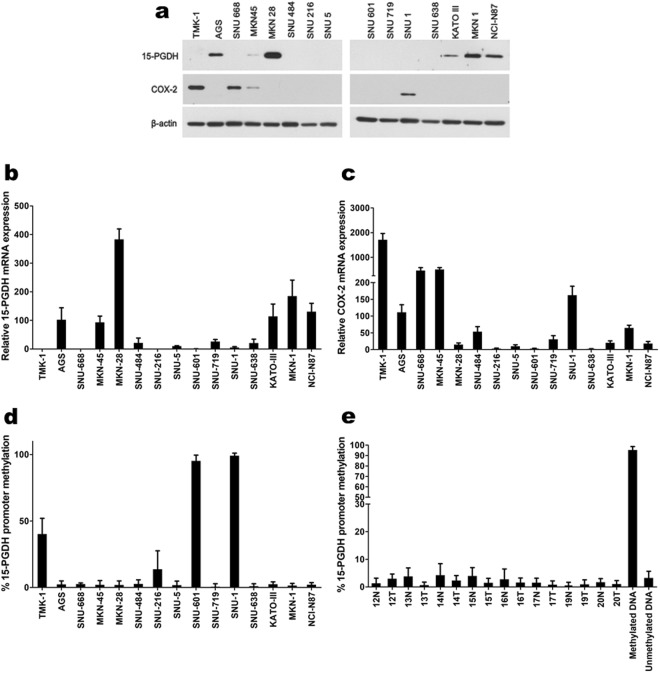
Figure 2.
(a) WB expression pattern of 15-PGDH and COX-2 in gastric cancer cell lines. (b,c), relative 15-PGDH (HPGD, b) and COX-2 (PTGS2, c) mRNA expression profiles in gastric cancer cell lines (expression of AGS was used as the standard = 100). The protein expression and mRNA expression exhibited strong correlations. The results are summarized in Supplementary Table 1. (d,e), 15-PGDH methylation assay by pyrosequencing in gastric cancer cell lines (d) and patient samples (e). Some of the cancer cells with no 15-PGDH expression showed methylation (TMK-1, SNU-216, SNU-601, SNU-1), whereas others did not (SNU-484, SNU-5, SNU-719, SNU-638). Error bars denote standard deviations.

