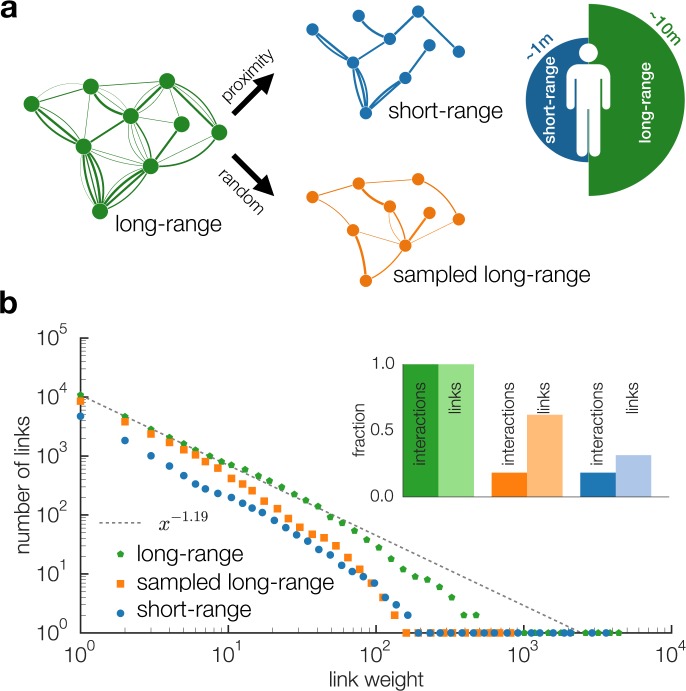
Figure 1.
The network of close proximity interactions. (a) The full network contains interactions with signal strength used as a proxy for a proximity. In this illustration the dynamic network is integrated over time; edges represent single interactions between participants, and line-width indicates physical proximity. From this full network, corresponding to all edges that support full-range transmission, we create the short-range network by only considering interactions with γijt ≥ −75 dBm. The sampled long-range network contains the same number of interactions but chosen at random. (b) The link weights (i, j) are broadly distributed. The dashed line is a power-law p(x) ~ x−α with α = 1.19 inserted as a guide to the eye. The sampled long-range network (orange) has the same number of interactions γijt as the short-range network (blue), but maintains 62% of links, compared to only 31% of links remaining in the short-range network (inset).

