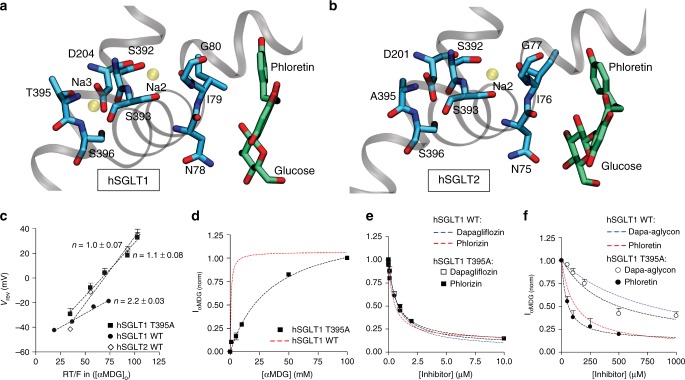
Fig. 4.
Allosteric communication between sodium and substrate sites. a The hSGLT1–phlorizin model shows the location of Na+ (transparent yellow) in the Na2 site over 8 Å from the inhibitor and the putative Na3 site 14 Å away. The Na2 Na+ interacts with the side chains of S392 and S393 and the carbonyl backbone of I79, while the ion at Na3 is stabilized by backbone carbonyls, side chains of T395 and S396, and bidentate interaction with D204. b The hSGLT2–phlorizin model shows the location of the conserved Na2 binding site (transparent yellow), but the putative Na3 site is lost by the hydrophobic substitution A395. c hSGLT1 T395A and wild-type hSGLT1 and hSGLT2 stoichiometries were determined from the reversal potential (Vrev). The inverse of the slope, Na+-to-glucose coupling ratio, n, is 1-to-1 Na+-to-substrate stoichiometry for the hSGLT2 wild-type and the T395A hSGLT1 mutant and 2-to-1 for wild-type hSGLT1. d αMDG dependence of hSGLT1 T395A (black squares) sugar current in injected oocytes. K0.5 = 34 ± 4 mM compared to K0.5 = 0.9 ± 0.1 mM for wild type. Data in d–f are normalized to the current measured in 10 mM αMDG without inhibitors, and the red dashed curves are representative, wild-type hSGLT1 responses. e Phlorizin (black squares) and dapagliflozin (open squares) effect on αMDG currents for hSGLT1 T395A in 30 mM αMDG. For hSGLT1 T395A Ki = 0.35 ± 0.10 and 0.4 ± 0.1 µM for phlorizin and dapagliflozin, respectively, while wild type estimated Ki = 0.22 ± 0.04 and 0.45 ± 0.02 µM for phlorizin and dapagliflozin, respectively. f Phloretin (black circles) and dapa-aglycon (open circles) effect on αMDG currents for hSGLT1 T395A in 30 mM αMDG. For hSGLT1 T395A Ki = 20 ± 7 and 187 ± 80 µM for phloretin and dapa-aglycon, respectively, while the wild-type Ki = 55 ± 12 and 425 ± 50 µM for phloretin and dapa-aglycon, respectively. Each data point is the mean ± SEM of n = 10 oocytes (c), n ≥ 5 oocytes (d), and n ≥ 7 oocytes (e, f)

