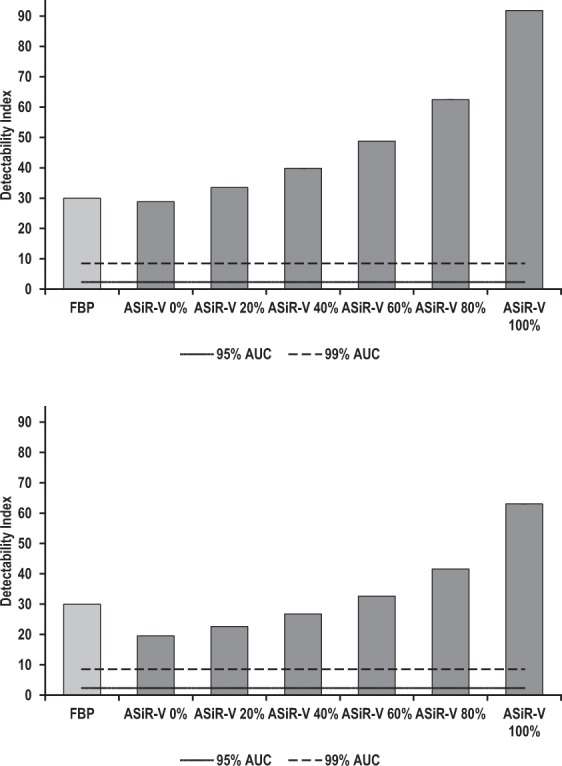
Figure 6.

Detectability indexes (d′) of simulated 4-mm-diameter solid non-calcified nodules as a function of the image reconstruction algorithm at regular (a) and reduced (b) dose levels. At regular dose, mean (95% confidence intervals) d’ ranged from 30.0 (29.9, 30.1) to 28.8 (28.8, 28.9) and 91.9 (91.6, 92.2) for FBP and 0% to 100% ASiR-V, respectively; whereas at reduced dose, mean (95% confidence intervals) d′ varied from 30.0 (29.9, 30.1) to 19.5 (19.5, 19.6) and 63.0 (62.9, 63.2) for FBP and 0% to 100% ASiR-V, respectively. Compared with FBP, detectability remained excellent (AUC ≥ 0.91), regardless of ASiR-V and dose levels. Detectability increased significantly with increasing ASiR-V levels to peak at 100% ASiR-V. Error bars represent 95% confidence intervals; they overlap with vertical bars. The solid and dashed lines represent 95% and 99% AUC, respectively.
