Fig. 4.
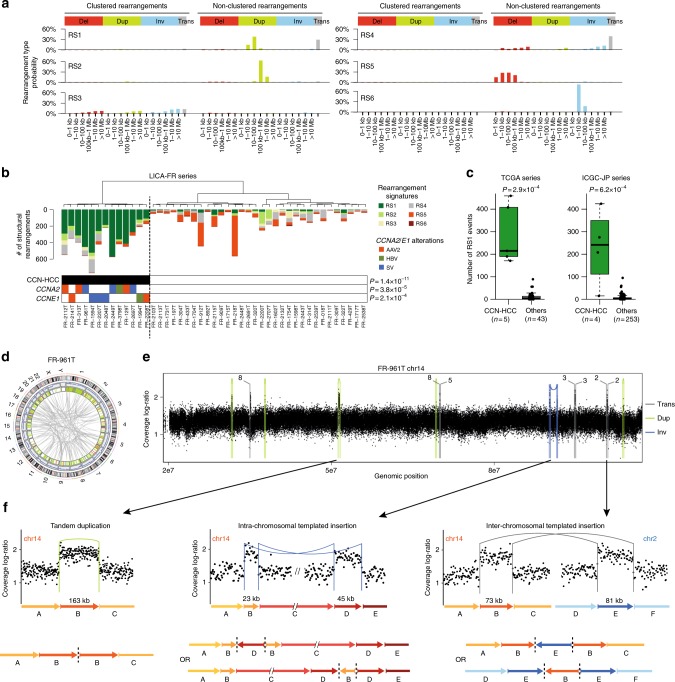
Cyclin-activated HCC display a specific signature or structural rearrangements. a Six rearrangement signatures identified across 350 HCC genomes by non-negative matrix factorization. Structural rearrangements were classified in 38 categories considering their type (del: deletion, dup: tandem duplication, inv: inversion, trans: inter-chromosomal translocation) and size, and distinguishing clustered from non-clustered events. The probability of each rearrangement category in each signature is represented, with rearrangement types indicated above and rearrangement sizes below. b Unsupervised classification of 45 HCC from the LICA-FR cohort based on the contribution of rearrangement signatures in each tumor. Significant molecular alterations associated with the cluster of tumors having a high contribution of signature RS1 are represented below. P-values were obtained using Fisher’s exact tests. c Validation of the association between the RS1 signature and CCN-HCC in the TCGA and ICGC-JP series. The middle bar, median; box, interquartile range; bars extend to 1.5 times the interquartile range. d CIRCOS plot representing the structural rearrangement profile of a representative CCN-HCC (FR-961T, harboring a GSTCD-CCNA2 fusion). e Copy-number profile showing the accumulation of focal gains along chromosome 14 in tumor FR-961T. Structural rearrangements are overlaid on the copy-number profile with a color code indicating the type of event. trans: inter-chromosomal translocation; dup: tandem duplication; inv: inversion. f Three types of rearrangements leading to focal chromosome gains in CCN-HCC. A representative example of each type of event is shown with a copy-number plot above and a schematic representation of the rearranged chromosome below. Structural rearrangements are represented with the same color code as in e. Dashed lines on schematic chromosome reconstructions represent the abnormal junctions detected in WGS data

