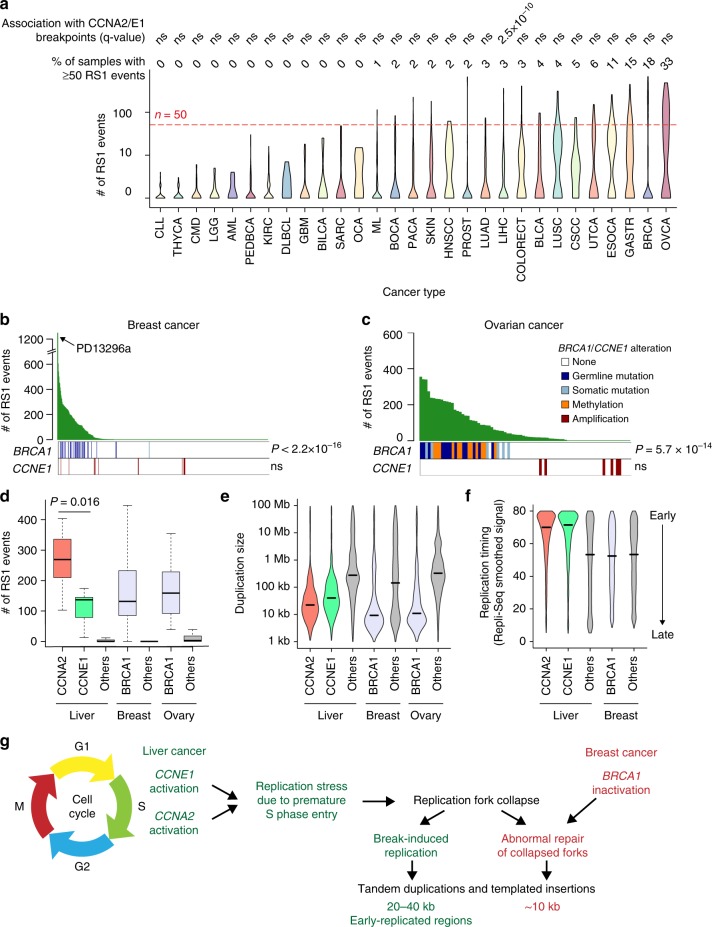
Fig. 6.
Pan-cancer analysis of the RS1 signature a Violin plots representing the number of rearrangements attributed to signature RS1 across patients within each cancer type in the ICGC PCAWG data set. For each cancer type, we assessed the association between tumors with ≥ 50 RS1 events and tumors with a rearrangement breakpoint < 80 kb from CCNA2 or CCNE1 gene using Fisher’s exact tests. ns: not significant. The definition of cancer codes and number of samples per cancer type are available in Supplementary Data 9. b Number of RS1 events across 524 breast cancer genomes30 and association with BRCA1 alterations and CCNE1 amplifications. PD13296a, the only tumor with both BRCA1 mutation and CCNE1 amplification, has the highest number of RS1 events in the series. c Number of RS1 events across 80 ovarian cancer genomes75 and association with BRCA1 alterations and CCNE1 amplifications. P-values were obtained using one-sided Wilcoxon rank-sum tests. d Number of RS1 events in liver, breast and ovarian cancers with or without CCNA2, CCNE1 and BRCA1 alterations. The middle bar, median; box, interquartile range; bars extend to 1.5 times the interquartile range. e, Violin plots representing the distribution of tandem duplication sizes across liver, breast and ovarian cancers with or without CCNA2, CCNE1 and BRCA1 alterations. f Violin plots representing the replication timing of duplication and inter-chromosomal translocation breakpoint loci in liver and breast cancers with or without CCNA2, CCNE1 and BRCA1 alterations. Replication timing was determined using Repli-Seq data from the HepG2 cell line for liver cancer and from the MCF-7 cell line for breast cancer. g Proposed connexion beween rearrangement signatures in CCN-HCC and in BRCA1-inactivated breast and ovarian cancers

