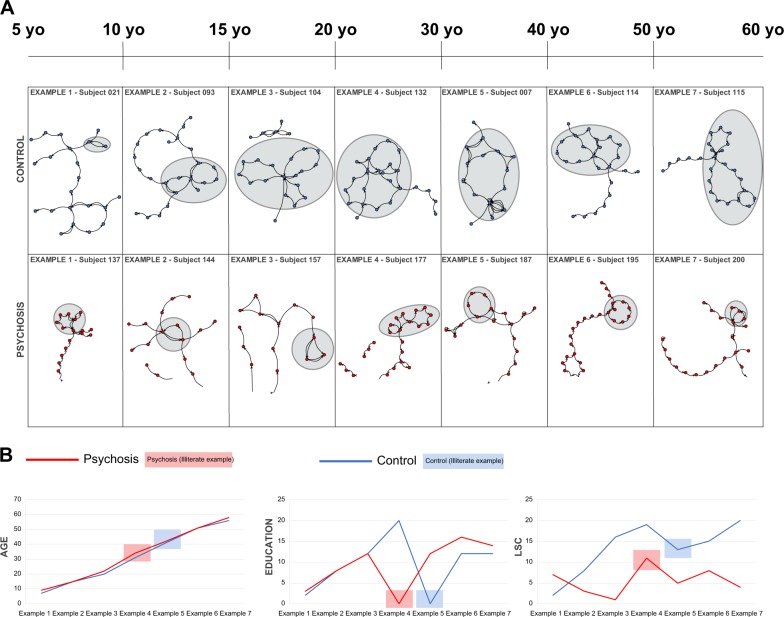
Fig. 2.
Qualitative representation of LSC across subjects spanning six decades of age and 2 decades of education. a Representative examples of graphs (initial 30 words) from subjects in the control subjects (blue dots) and patients with psychosis (red dots). Ellipses in grey denote LSC. b The LSC dynamic range for the examples shown above is twice as large for the control subjects than for the patients with psychosis. Data from two illiterate adults with no formal education (highlighted in red and blue) are shown. Note that the lack of education seems to greatly impact LSC among control subjects, but not among patients with psychosis

