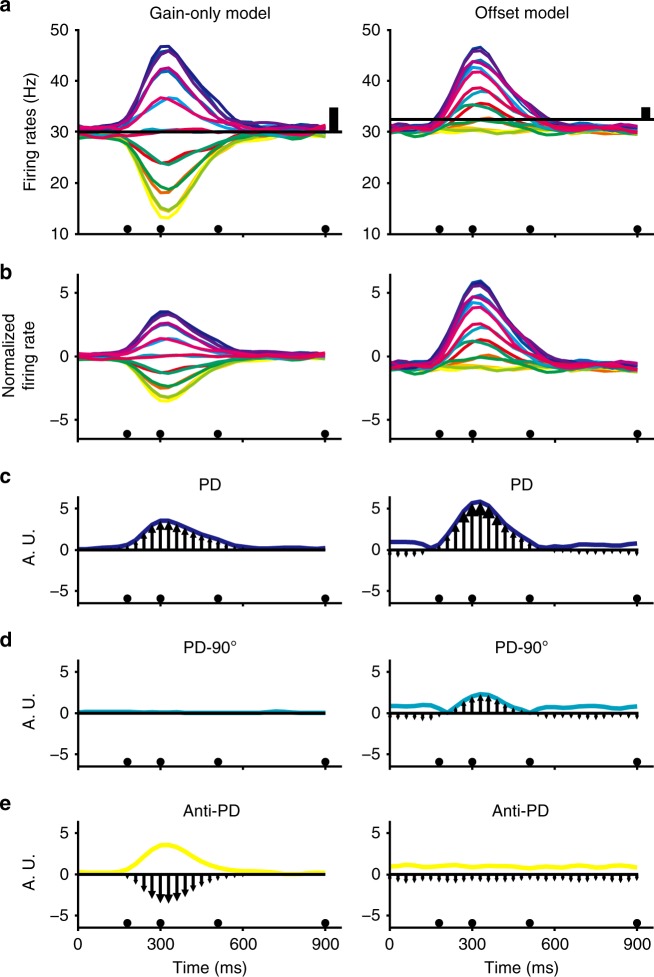
Fig. 4.
The use of a conventional direction-only encoding model when firing rates were generated with either the gain-only (left column) or offset model (right column). a Simulated firing rates for one neuron and 16 target directions (same color map as in Fig. 1). The horizontal black lines represent estimated baseline, vertical black lines represent estimated modulation depth. b Firing rates normalized by estimated baseline and modulation depth using Eq. (10). c Vector magnitudes pointing to the preferred direction θPD (arrows), the colored traces represent the absolute magnitudes. d Same as c for the orthogonal direction to θPD, (θPD - 90°). e Same as c in the anti-preferred direction (θPD-180°). A.U.: arbitrary unit

