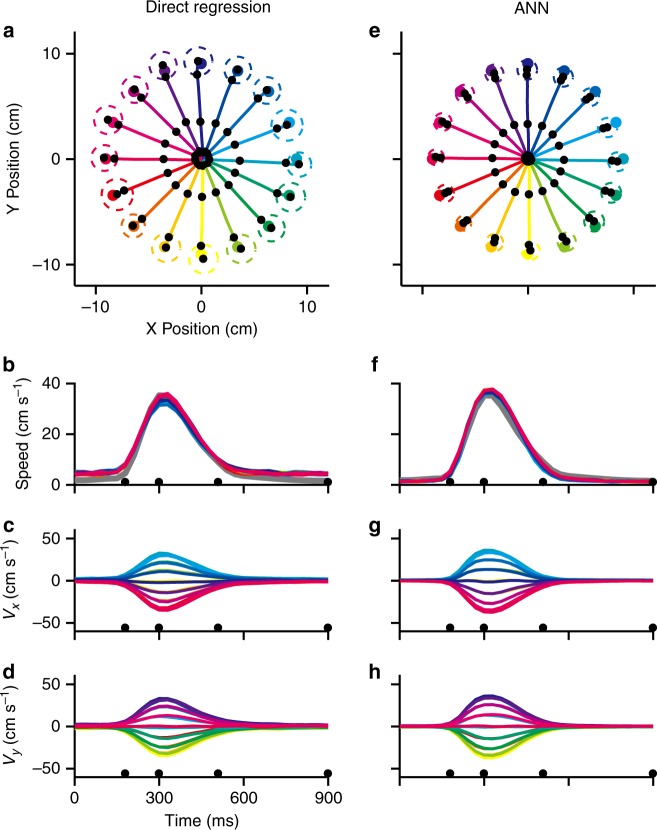
Fig. 6.
Population decoding using data simulated with non-uniform distribution of preferred directions and the offset model. a–d Direct Regression decoder. e–h ANN decoder. a, e reconstructed trajectories for the 16 targets. The radii of the dashed circles represent the averaged distance between end-point positions and their mean. b, f reconstructed speed profiles. The thick gray line represents the original speed profile. The decoded velocity components, Vx and Vy, are shown respectively in c, g; d, h

