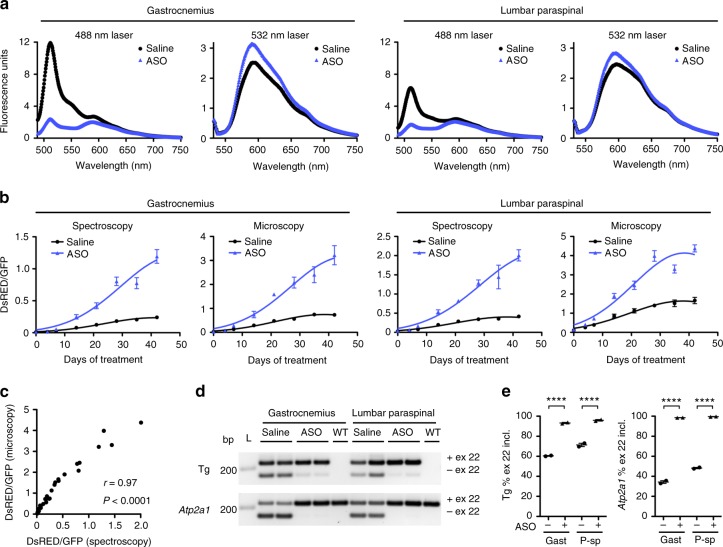
Fig. 5.
Comparison of in vivo fluorescence microscopy and spectroscopy. We treated TR;HSALR bi-transgenic mice with saline or ASO 445236 (N = 2 each) by subcutaneous injection (25 mg/kg twice weekly for 4 weeks)8 and monitored DsRed and GFP fluorescence using in vivo spectroscopy and microscopy for 6 weeks. a Representative corrected fluorescence spectra, excited at 488 nm and 532 nm in gastrocnemius (left) and lumbar paraspinal (right) muscle 42 days after beginning treatment with saline (black circles) or ASO (blue triangles). b Serial in vivo fluorescence spectroscopy and microscopy measurements through 42 days showing ratio of fitted DsRed fluorescence magnitude to fitted GFP fluorescence magnitude in gastrocnemius and lumbar paraspinal muscles of TR;HSALR bi-transgenic mice treated with saline (black circles) or ASO (blue triangles). Error bars indicate mean ± s.e.m. Non-linear regression. c Correlation of DsRed/GFP values as measured by spectroscopy (x-axis) and microscopy (y-axis) at each time point. The correlation coefficient r and P value are shown. d Exon 22 splicing analysis by RT-PCR of transgene (Tg) and endogenous mouse Atp2a1 in gastrocnemius and lumbar paraspinal muscles of saline- and ASO-treated mice at Day 42. L DNA ladder, bp base pairs. e Quantitation of the splicing results in d. Error bars indicate mean ± s.e.m. ****P < 0.0001, saline vs. ASO; two-way ANOVA

