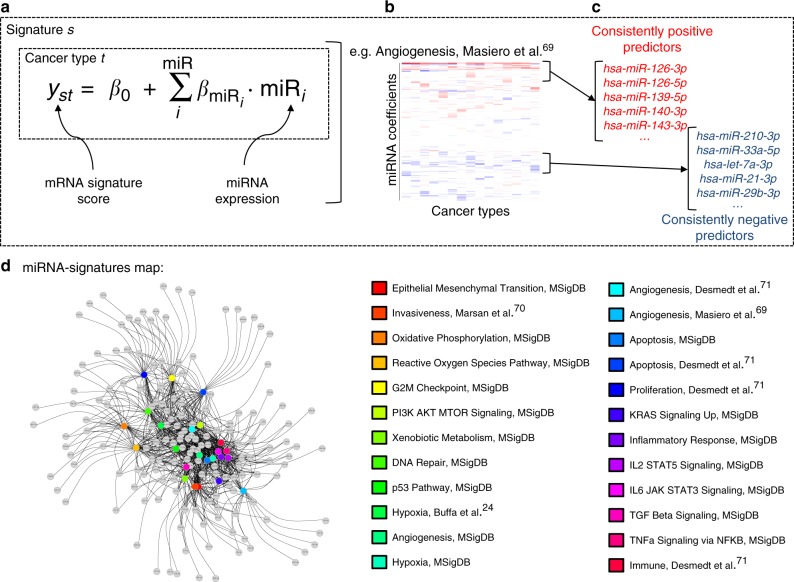
Fig. 1.
Overview of approach used to identify hallmarks-associated miRNA. a Overview of the linear model used in the fitting, for each gene signature and cancer type under consideration. b Example of a heatmap depicting the values of the coefficients identified for the miRNA predictors (rows), across cancer types (columns) for our previously developed angiogenesis signature69. c Consistently positive and negatively ranking miRNA coefficients, identified as statistically significant by the rank product statistic, are taken as the positive and negative hallmark-associated miRNA for each hallmark signature. d Network map of signatures (coloured circles) and their positively associated miRNA (grey circles), connected by edges when an association was found, highlighting strong interconnectivity between distinct molecular signatures

