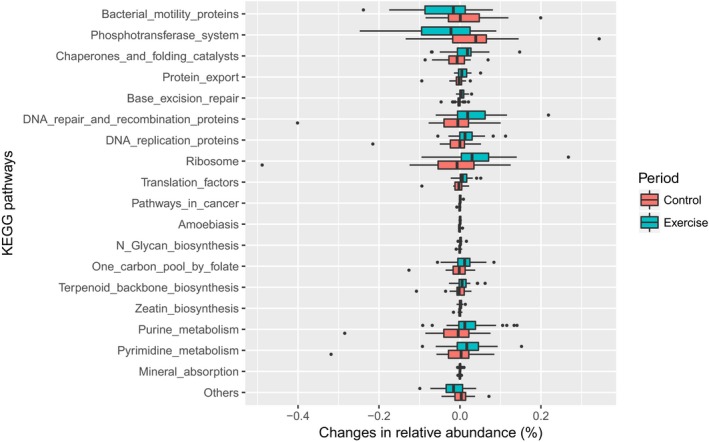
Figure 5.

Changes in predicted metagenome functions that were significantly different between control and exercise periods. Changes in the relative abundance of each metagenomic function predicted based on the KEGG database are presented as box‐plots with the median value and the interquartile range. Significant differences were evaluated by the Mann–Whitney U test. All of the changes in metagenomic functions were significantly different between the exercise and control periods at the significance level of 0.05 and FDR < 0.3.
