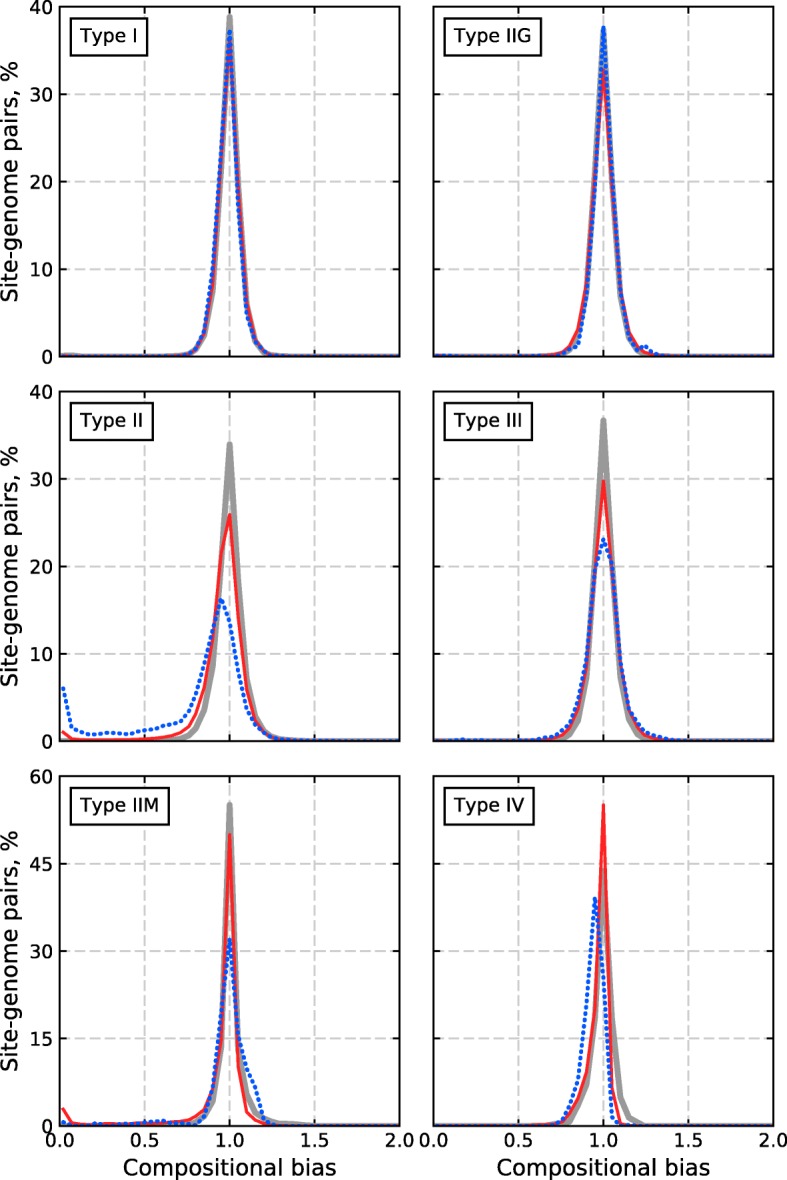
Fig. 3.

Histograms of compositional bias values for different types of R-M systems. Dotted blue lines correspond to the subsets of the Experimental dataset, solid red lines are for Control dataset 1, and gray solid lines are for Control dataset 2

Histograms of compositional bias values for different types of R-M systems. Dotted blue lines correspond to the subsets of the Experimental dataset, solid red lines are for Control dataset 1, and gray solid lines are for Control dataset 2