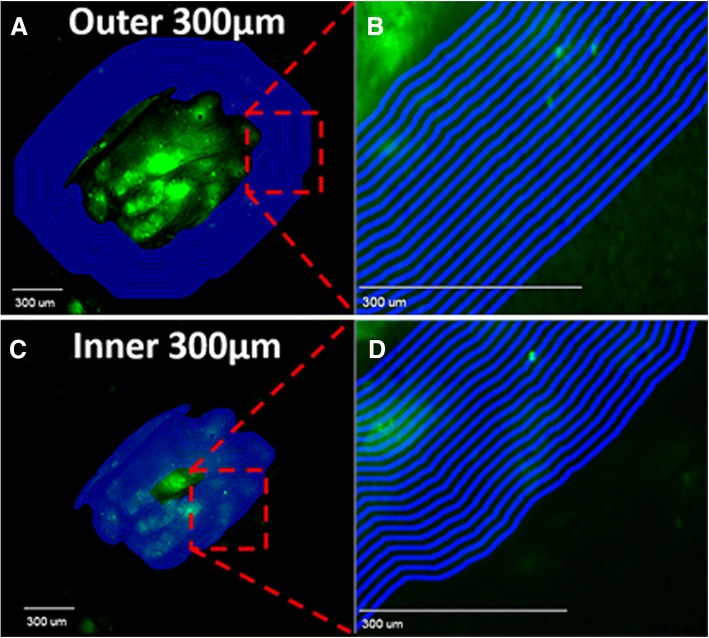
Fig. 1.
Circumferential Fluorescent Analysis by Quantitative Fluorescence Microscopy. Fluorescent image of eGFP transfected MDA-MB-231Br metastasis in brain with circumferential 8 μm thick regions of interest (ROI) drawn to 300 μm beyond the metastasis margin (a and b). To distinguish between BAT and tumor regions, the inner 300 μm from the metastasis margin were used to create 8 μm thick circumferential ROIs (c and d)

