Fig. 5.

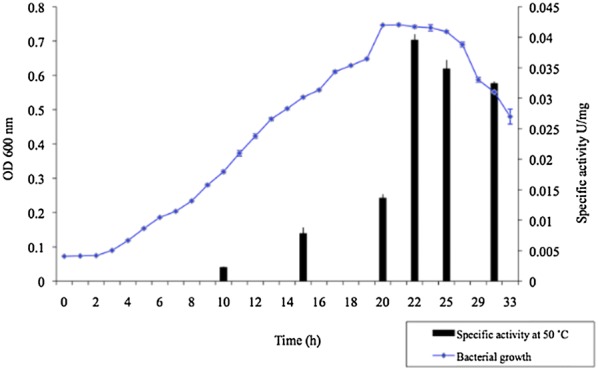
Bacterial growth curve and GDH specific activity. The specific activity was determined in the oxidative deamination reaction at 50 °C. Error bars show the variation obtained from three biological replicates

Bacterial growth curve and GDH specific activity. The specific activity was determined in the oxidative deamination reaction at 50 °C. Error bars show the variation obtained from three biological replicates