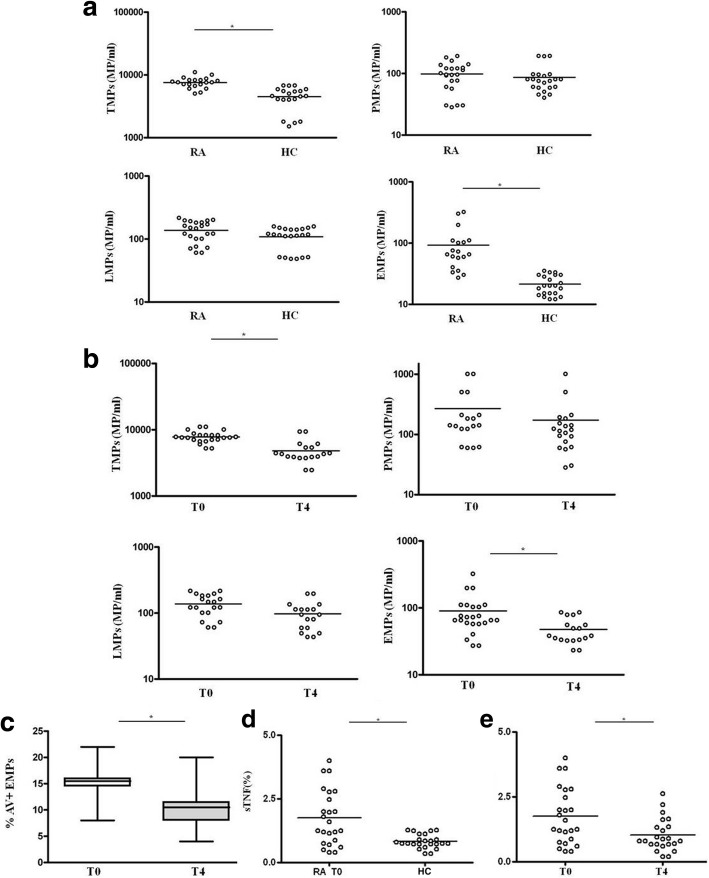
Fig. 3.
Plasma levels of microparticles (MPs) in patients with rheumatoid arthritis (RA) at time zero (baseline (T0)) and after 4 months of treatment (T4) and in healthy controls (HC) and surface expression of TNFα. a Relative distribution of total MPs (TMPs), platelet MPs (PMPs), leukocyte MPs (LMPs) and endothelial MPs (EMPs) in 20 patients with rheumatoid arthritis (RA) and 20 healthy controls (HC). b, c Relative distribution of TMPs, PMPs, LMPs, EMPs (a) and EMPs annexin-V (AV)+ (c) in patients with RA at time zero (baseline (T0) and 4 months after treatment (T4). d Relative distribution of the percentage of the expression of TNFα on the surface of MPs from patients with RA and HC. e Relative distribution of TNFα expression on MPs from patients with RA at T0 and T4. Each data point represents a single subject; horizontal lines show the median. Groups were compared using Student’s t test; *p < 0.05

