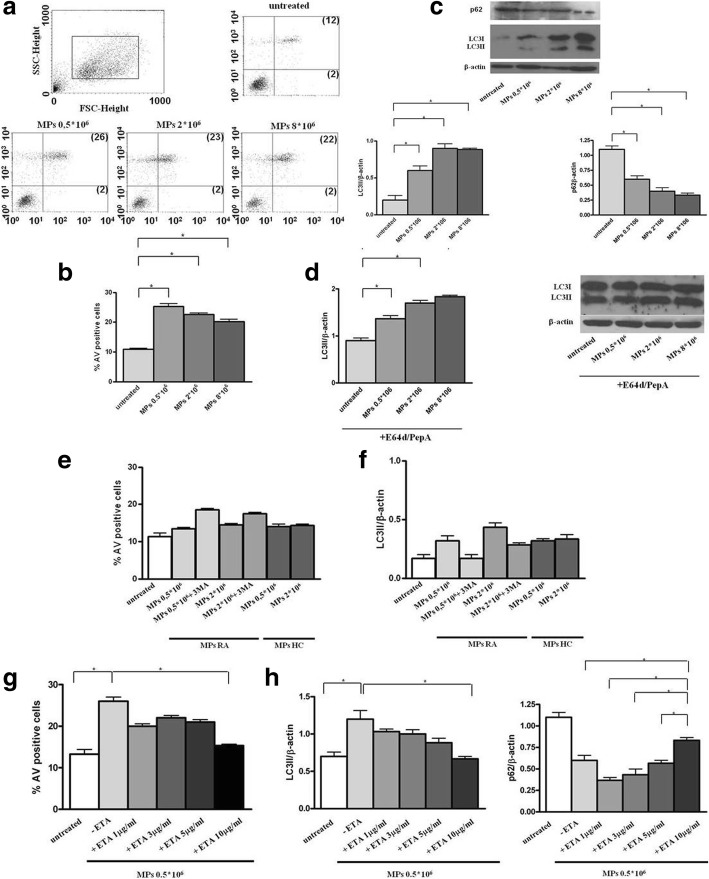
Fig. 6.
Induction of apoptosis and autophagy in EA.hy926 cells by microparticles (MPs) isolated from patients with rheumatoid arthritis (RA) after in vivo and in vitro treatment with etanercept (ETA) and by MPs isolated from healthy controls (HC). a Flow cytometry analysis of apoptosis in untreated MPs and MPs treated with EA.hy926 cells. Results obtained in a representative experiment are shown. Numbers in the upper and bottom right quadrants of each plot refer to annexin-V (AV)/propidium iodide (PI) double-positive cells and to AV single-positive cells, respectively. b Mean ± SD of the percentages of AV-positive cells obtained in three independent experiments; *p < 0.05. c, d Western blot analysis of LC3-II (left panel) and p62 (right panel) levels in EA.hy926 cells cultured with MPs purified from patients with RA at time zero (baseline (T0)), in the absence (c) or in the presence (d) of lysosomal inhibitors E64d and pepstatin A (PepA). Blot shown is representative of three independent experiments. e, f Flow cytometry analysis of apoptosis (e) and western blot analysis (f) of LC3-II in EA.hy926 cells cultured with (i) MPs purified from patients with RA after 4 months of treatment with ETA, (ii) MPs purified from HC, and (iii) in the presence or absence of the autophagy inhibitor 3MA. g, h Flow cytometry analysis of apoptosis (g) and western blot analysis (h) of LC3-II (left panel) and p62 (right panel) levels in EA.hy926 cells cultured with MPs purified from patients with RA at T0 and with MPs from patients with RA at T0 in vitro-treated with ETA. e-h Mean ± SD of the percentages of AV-positive cells obtained in three independent experiments is reported and densitometry analysis of LC3-II and p62 levels relative to β-actin is shown. Values are expressed as means ± SD; *p < 0.05. FSC, forward scatter; SSC, side scatter

