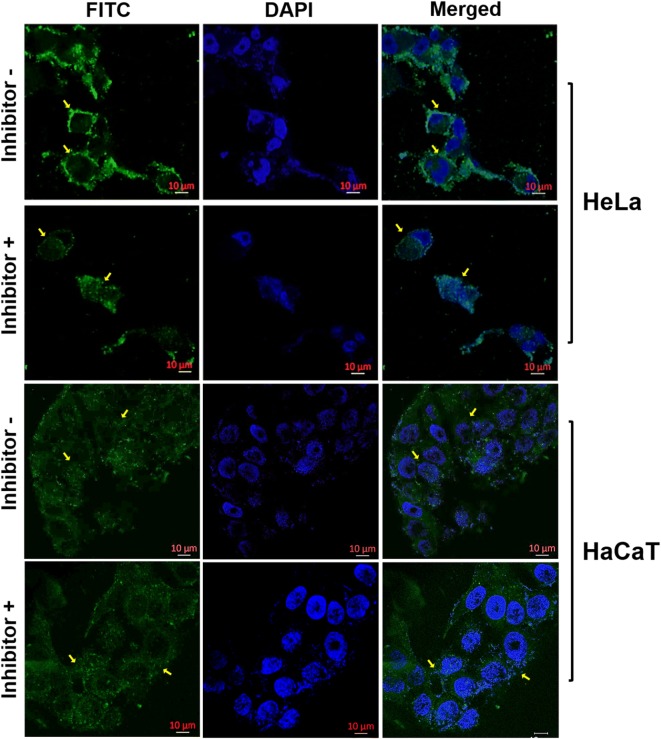
Fig. 4.
Cancer cell imaging with nanotube-FITC. Cellular interaction of nanotube-FITC with HeLa (top two rows) and in HaCaT (bottom two rows) cells at 4 h (Inhibitor −), Cellular binding of nanotube-FITC following 1 h treatment of the integrin inhibitor given after 4 h of incubation of the conjugate with the cells (Inhibitor +). Cell nuclei are stained with DAPI (blue color) and merged is an overlay of images acquired using FITC and DAPI acquisition channel

