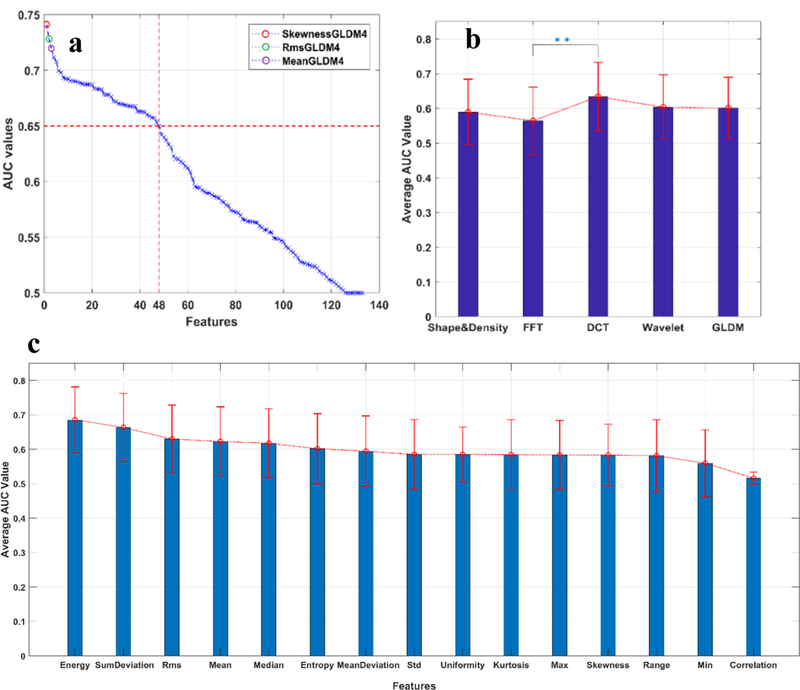
Figure 5:

The performance of the spatial and frequency domain features. All the features were sorted using the AUC value as an indicator of feature discrimination power. The top performing features are indicated with color circles in (a).From (a), it can also be observed that 48 of total 133 features (i.e. 36%) achieve an AUC value higher than 0.65. (b) shows comparison of the average performance of the five group features. The result showed that the DCT group was significantly more effective than the FFT group, and slightly advantageous over the other three groups. (c) displays the average performance of each of the 15 statistical measures. Although the performance of the energy and sumDeviation were found to be significantly distinct, most of the remaining measures generated compatible AUC values, i.e., around 0.6, suggesting the effectiveness of almost all the chosen statistical measures in our study.
