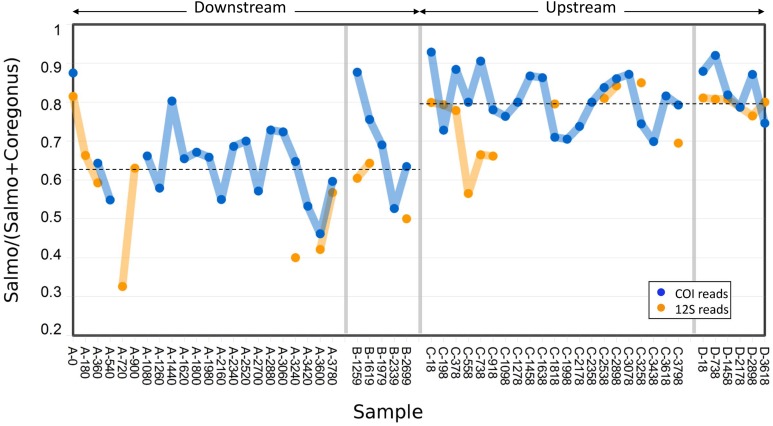
Figure 3. Abundance of Atlantic salmon (genus Salmo) sequence reads relative to Cisco and Bloater (genus Coregonus) sequence reads at upstream and downstream sites.
Grab replicates are pooled. Relative abundance estimates from 12S and COI sequence counts are plotted separately, with the mean values at each site indicated by dashed lines. No significant correlation between relative Salmo eDNA abundance and time was found, whereas the difference in means between sites was statistically significant (see Results).

