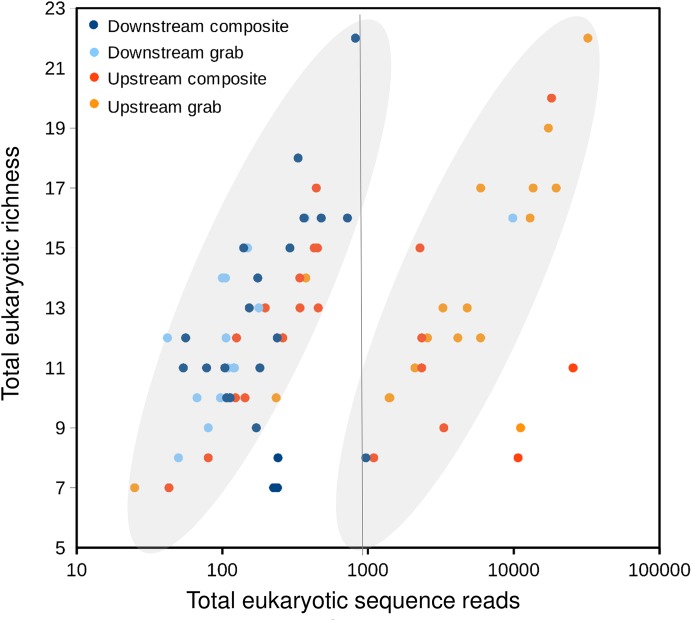
Figure 6. Scatterplot of eukaryotic richness versus eukaryotic sequence counts, log-scaled, by sampler.
The gray ovals highlight a natural break in the distribution of points, between modes of relatively low and relatively high sequence counts for equivalent levels of richness. That is, samples plotted to the right of the vertical line as a group have accumulated richness more slowly per sequencing effort than those plotted to the left of the line. While some positive relationship between sequence counts and richness per sample is expected, the existence of two distinct populations of points is subjective and hypothetical, and does not imply that explicit mathematical functions relating sequence counts to richness have been derived.

