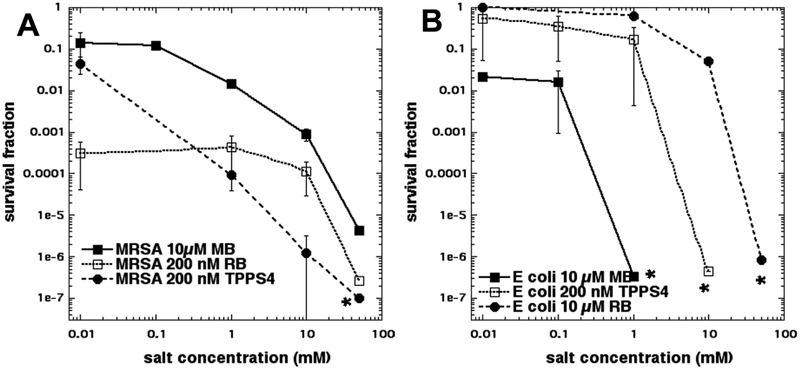
Figure 3. Effect of increasing KSeCN concentration on aPDT with three photosensitizers.
Cells were incubated for 30 min with MB at 10 μM, or RB at 200 nm for MRSA or 10 μM for E. coli, or TPPS4 at 200 nM, plus KSeCN at increasing concentrations, and then irradiated with 10 J/cm2 of light (660 nm for MB; 540 nm for RB; 415 nm for TPPS4). (A) Gram-positive MRSA; (B) Gram-negative E. coli. * indicates eradication. The concentration of 0.01 mM salt was actually zero, but zero cannot be used on a logarithmic axis.

