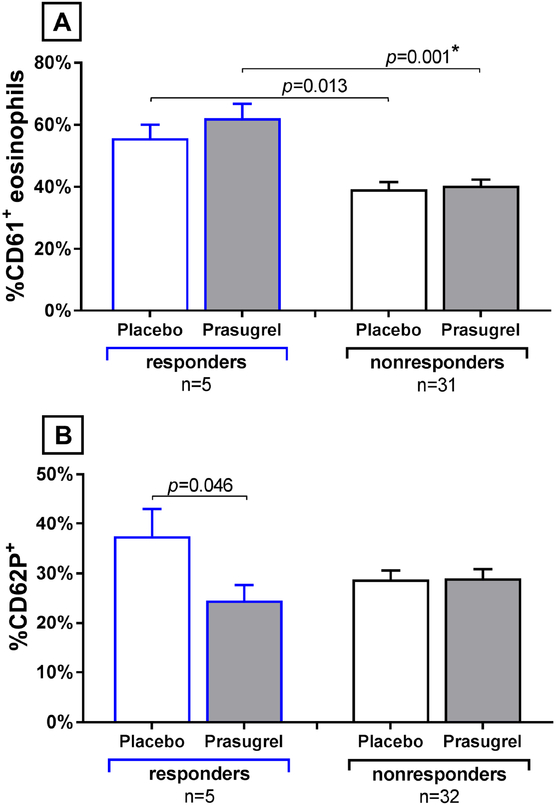
FIG 7. Responder vs non-responder platelet activation and platelet-leukocyte aggregates.
(A) Percentages of eosinophils with adherent platelets before aspirin administration are shown for each treatment arm for the responders (n=5, blue lines) and the non-responders. (B) Percentages of platelets that expressed surface CD62P are shown for the two patient subgroups, at the same timepoints. Data are expressed as mean + SE. P-values with a * are significant using a False Discovery Rate of 0.05 to correct for multiple comparisons.

