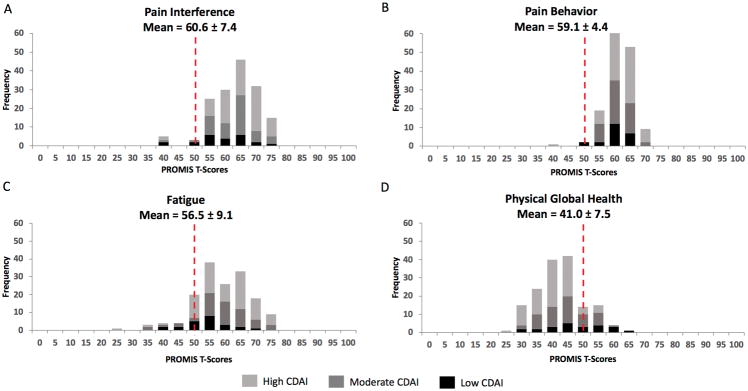
Figure 1.
Distributions of PROMIS scores for study participants at baseline (N = 156).
Distributions of PROMIS Pain Interference (A), Pain Behavior (B), Fatigue (C) and Physical Global Health (D) T-Scores for study participants showing scores by CDAI level at baseline (N = 156). Dotted line represents the general population mean score of 50.

