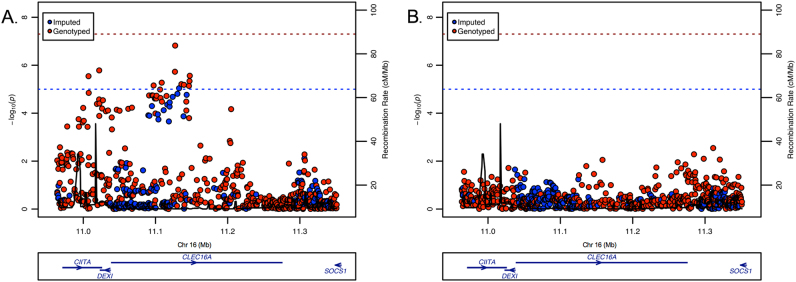
Fig. 2.
Genetic association of variants at the 16p13 loci with EoE risk. a P values (−log10) from the genetic association analysis of genotyped and imputed variants are plotted against the genomic position of each genotyped (blue) and imputed (red) single-nucleotide polymorphism (SNP) on the x axis on chromosome 16. b P values (−log10) from the genetic association analysis adjusting for the association of rs12924112 of genotyped and imputed variants are plotted against the genomic position of each genotyped (blue) and imputed (red) SNP on the x axis on chromosome 16. Genes in the region are shown below. Position is given relative to Build 37 of the reference genome. Black lines indicate the recombination rates determined using subjects of European ancestry from the 1000 Genomes Project

