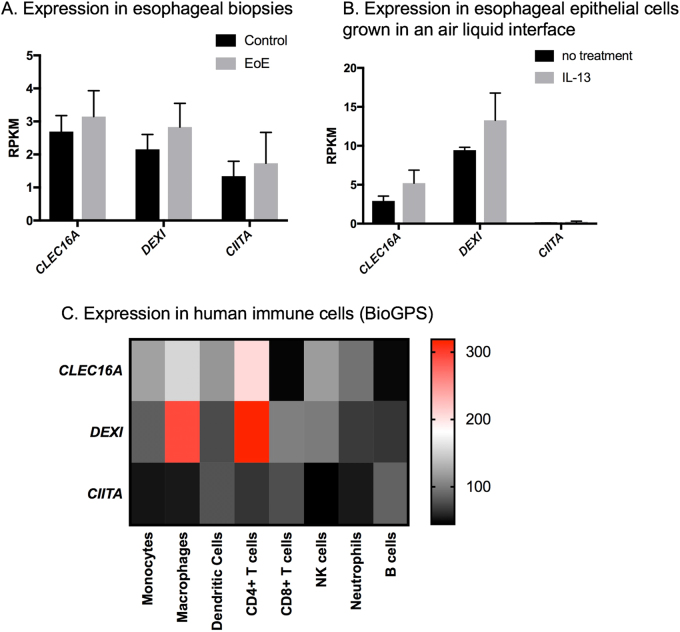
Fig. 3.
Expression of genes at the 16p13 locus. a RNAseq expression of CLEC16A, DEXI, and CIITA mRNA from esophageal biopsies (Control n = 10, EoE n = 10). No significant differences were identified between Control and EoE. b RNAseq expression of genes from esophageal epithelial cells in air-liquid interface culture system with or without IL-13 stimulation for 5 days (n = 3 wells per group). For a and b, bars represent the mean and error bars represent the standard deviation. No significant differences were identified between no treatment and IL-13 treatment. c Barcode x-score relative microarray expression of CLEC16A, DEXI, and CIITA in various human immune cell subsets downloaded from http://biospgs.org/ (ref. [48]). Reads per killobase of transcript per million mapped reads, RPKM. Data are representative from multiple cellular subtypes in the Primary Cell Atlas dataset

