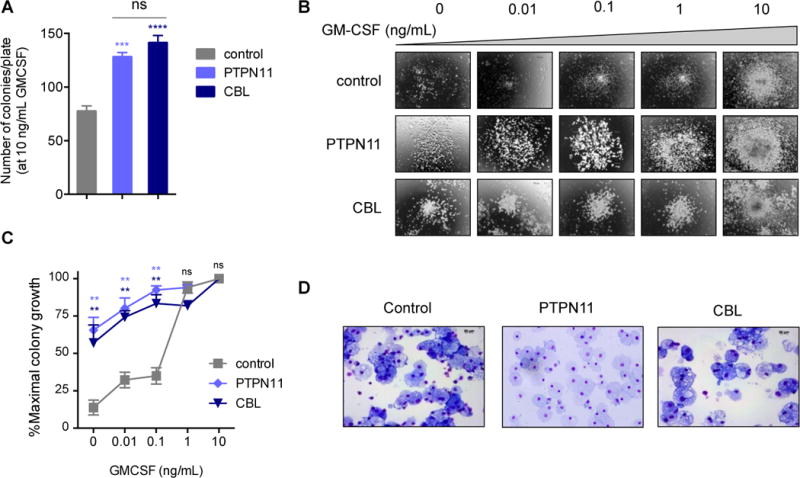
Figure 1. GM-CSF hypersensitivity of patient-derived PTPN11- and CBL-mutant JMML iPSCs.

(A) Total number of myeloid colonies per 1500 day 8 progenitor cells derived from control, PTPN11-, and CBL-mutant iPSCs were cultured with 10 ng/mL GM-CSF after 14 days. Assays were performed in triplicate. (B) Representative photomicrographs of day 8 control, PTPN11, and CBL iPSC-derived myeloid colonies cultured with increasing doses of GM-CSF. (C) Percent of maximal colony number is displayed for each iPSC-derived progenitor cell line incubated with increasing GM-CSF concentrations. (D) Representative cytospin photomicrographs of cells from control, PTPN11, and CBL myeloid colonies with May-Grünwald-Giemsa staining (shown at 40×). PTPN11 and CBL colony data were compared to control data by one-way ANOVA with the Dunnett post-test for multiple comparisons. **p<0.01, ***p<0.001, ****p<0.0001, ns = not significant.
