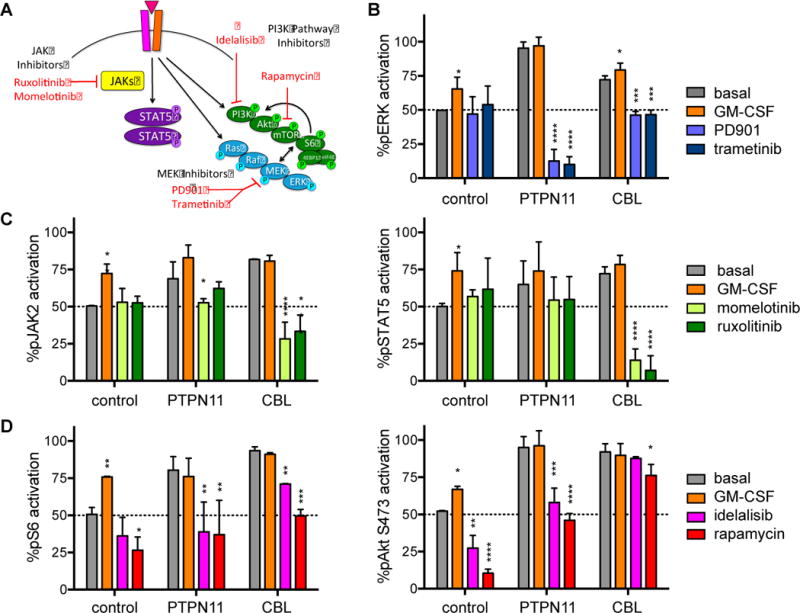
Figure 3. Inhibition of signaling phosphoproteins in JMML iPSCs.

Day 14 control, PTPN11, and CBL iPSC-derived CD45+14+18+ myeloid cells were washed and incubated in vitro in serum-free medium with GM-CSF 10 ng/mL (positive signaling control) or (A) MEK inhibitors (PD901 100 nM, trametinib 100nM), JAK inhibitors (momelotinib 1 uM, ruxolitinib 1 uM), or PI3K pathway inhibitors (idelalisib 1 uM, rapamycin 10 nM) for 60 minutes at 37°C prior to antibody staining and phosphoflow cytometry analysis. Flow cytometry data for each phosphoprotein and iPSC line were gated as in Figure 2 and Supplemental Figure 1. (B) Percent pERK, (C) pJAK2 and pSTAT5, and (D) pS6 and pAkt activation for each cell line and inhibitor condition are displayed relative to mean basal phosphoprotein levels of control CD45+14+18+ myeloid cells. Experiments were performed in triplicate. Statistical analyses were performed with ANOVA and the Dunnett post-test for multiple comparisons. *p<0.05, **p<0.01, ***p<0.001, ****p<0.0001.
