
Figure 4.
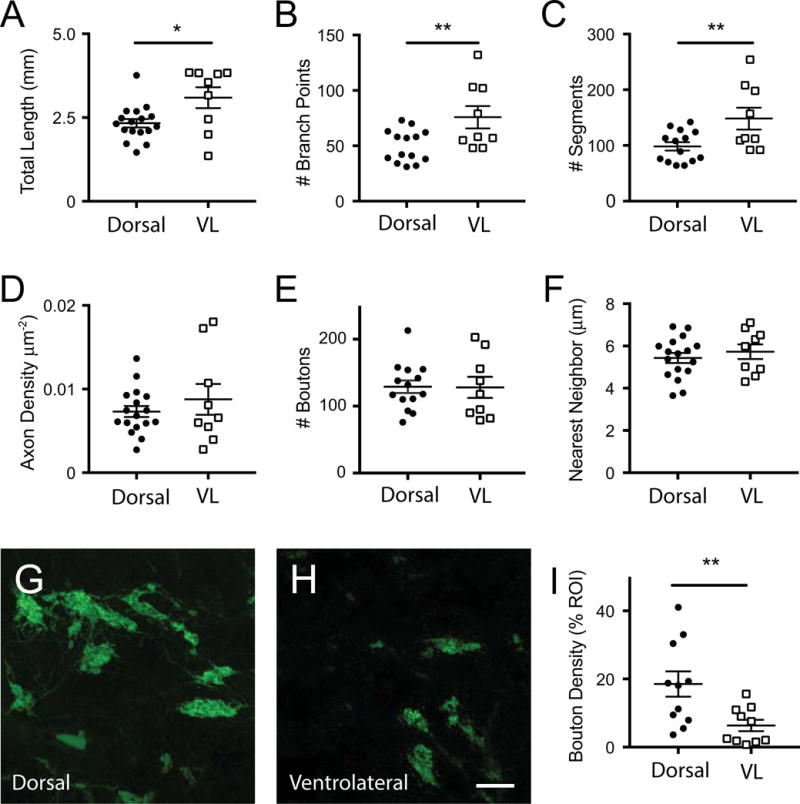
Quantification of single axon arbor morphology across dLGN. The average properties of BD-RGC axon arbors in the dorsal (dorsal caudal and dorsal anterior arbors in Figure 2) vs. ventrolateral (VL) region (in Figure 3) are shown for A. total length; B. # branch points; C. # segments, D axon density, E. Bouton #, F. bouton nearest neighbor. G-I: Analysis of total bouton density of BD-RGC axons in densely labeled Hb9-GFP mice. Representative confocal images from the dorsal (G) and ventrolateral (H) regions of the dLGN and quantification of bouton density measured as the % area of the GFP-labeled boutons (I). All data sets were normally distributed based on the D’Agostino & Pearson normality test and analyzed using the student t-test. *p<0.05., ** p<0.01. Lines indicated mean ± SEM. Scale bar (G, H): 10 μm.