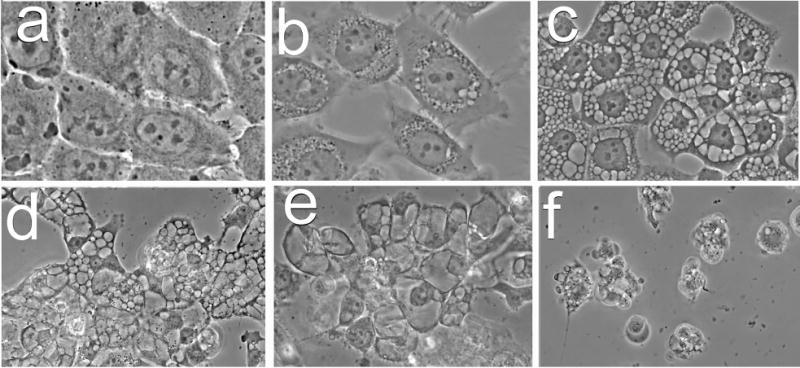
Figure 2.

The chronology of paraptosis. Images were acquired sequentially after irradiation of OVCAR-5 cells photosensitized with hypericin as described in the text. Legend: a, before irradiation; b-f, images acquired after irradiation (180 mJ/sq cm at 600 nm): b, 1 h; c, 4 h; d, 24 h; e, adhering cells after 48 h; f, floating cells after 48 hr.
